Why is the virtual machine's (Virtualbox) performance better than LXD

I created two Bitrix Environment with virtualbox and lxd. The performance of those two environments is very different. Virtualbox is a lot more performance than lxd. Does anyone know where the cause is and how to fix it for LXD?

The performance monitor
On Virtualbox:

On LXD:

My settings:
LXD:
screenshot_25
8 CPUs, 3GB RAM

Virtualbox:

Can you show lxc config show NAME --expanded?

1 Like

I see on your screenshot ‘vmware server 1.06’. Do I understand correctly that you are running all this on a virtual machine whose last supported version 1.10 was released 11 years ago !!?

Can you also provide the output of cat /proc/cpuinfo in both VMs please

1 Like

Ohh, that’s just the announcement of the Bitrix application they made. It represents the Standard column

This is it

Thanks for your rep!

This is it:
On Virtualbox

processor : 0
vendor_id : GenuineIntel
cpu family : 6
model : 60
model name : Intel® Core™ i7-4810MQ CPU @ 2.80GHz
stepping : 3
cpu MHz : 2793.542
cache size : 6144 KB
physical id : 0
siblings : 4
core id : 0
cpu cores : 4
apicid : 0
initial apicid : 0
fpu : yes
fpu_exception : yes
cpuid level : 13
wp : yes
flags : fpu vme de pse tsc msr pae mce cx8 apic sep mtrr pge mca cmov pat pse36 clflush mmx fxsr sse sse2 ht syscall nx rdtscp lm constant_tsc rep_good nopl xtopology nonstop_tsc eagerfpu pni pclmulqdq ssse3 cx16 pcid sse4_1 sse4_2 x2apic movbe popcnt aes xsave avx rdrand hypervisor lahf_lm abm invpcid_single fsgsbase avx2 invpcid md_clear flush_l1d
bogomips : 5587.08
clflush size : 64
cache_alignment : 64
address sizes : 39 bits physical, 48 bits virtual
power management:

processor : 1
vendor_id : GenuineIntel
cpu family : 6
model : 60
model name : Intel® Core™ i7-4810MQ CPU @ 2.80GHz
stepping : 3
cpu MHz : 2793.542
cache size : 6144 KB
physical id : 0
siblings : 4
core id : 1
cpu cores : 4
apicid : 1
initial apicid : 1
fpu : yes
fpu_exception : yes
cpuid level : 13
wp : yes
flags : fpu vme de pse tsc msr pae mce cx8 apic sep mtrr pge mca cmov pat pse36 clflush mmx fxsr sse sse2 ht syscall nx rdtscp lm constant_tsc rep_good nopl xtopology nonstop_tsc eagerfpu pni pclmulqdq ssse3 cx16 pcid sse4_1 sse4_2 x2apic movbe popcnt aes xsave avx rdrand hypervisor lahf_lm abm invpcid_single fsgsbase avx2 invpcid md_clear flush_l1d
bogomips : 5587.08
clflush size : 64
cache_alignment : 64
address sizes : 39 bits physical, 48 bits virtual
power management:

On LXD:

processor : 0
vendor_id : GenuineIntel
cpu family : 6
model : 60
model name : Intel® Core™ i7-4810MQ CPU @ 2.80GHz
stepping : 3
microcode : 0x27
cpu MHz : 1523.244
cache size : 6144 KB
physical id : 0
siblings : 8
core id : 0
cpu cores : 4
apicid : 0
initial apicid : 0
fpu : yes
fpu_exception : yes
cpuid level : 13
wp : yes
flags : fpu vme de pse tsc msr pae mce cx8 apic sep mtrr pge mca cmov pat pse36 clflush dts acpi mmx fxsr sse sse2 ss ht tm pbe syscall nx pdpe1gb rdtscp lm constant_tsc arch_perfmon pebs bts rep_good nopl xtopology nonstop_tsc cpuid aperfmperf pni pclmulqdq dtes64 monitor ds_cpl vmx smx est tm2 ssse3 sdbg fma cx16 xtpr pdcm pcid sse4_1 sse4_2 x2apic movbe popcnt tsc_deadline_timer aes xsave avx f16c rdrand lahf_lm abm cpuid_fault epb invpcid_single pti ssbd ibrs ibpb stibp tpr_shadow vnmi flexpriority ept vpid fsgsbase tsc_adjust bmi1 avx2 smep bmi2 erms invpcid xsaveopt dtherm ida arat pln pts md_clear flush_l1d
bugs : cpu_meltdown spectre_v1 spectre_v2 spec_store_bypass l1tf mds swapgs itlb_multihit
bogomips : 5586.43
clflush size : 64
cache_alignment : 64
address sizes : 39 bits physical, 48 bits virtual
power management:

processor : 1
vendor_id : GenuineIntel
cpu family : 6
model : 60
model name : Intel® Core™ i7-4810MQ CPU @ 2.80GHz
stepping : 3
microcode : 0x27
cpu MHz : 1775.776
cache size : 6144 KB
physical id : 0
siblings : 8
core id : 0
cpu cores : 4
apicid : 1
initial apicid : 1
fpu : yes
fpu_exception : yes
cpuid level : 13
wp : yes
flags : fpu vme de pse tsc msr pae mce cx8 apic sep mtrr pge mca cmov pat pse36 clflush dts acpi mmx fxsr sse sse2 ss ht tm pbe syscall nx pdpe1gb rdtscp lm constant_tsc arch_perfmon pebs bts rep_good nopl xtopology nonstop_tsc cpuid aperfmperf pni pclmulqdq dtes64 monitor ds_cpl vmx smx est tm2 ssse3 sdbg fma cx16 xtpr pdcm pcid sse4_1 sse4_2 x2apic movbe popcnt tsc_deadline_timer aes xsave avx f16c rdrand lahf_lm abm cpuid_fault epb invpcid_single pti ssbd ibrs ibpb stibp tpr_shadow vnmi flexpriority ept vpid fsgsbase tsc_adjust bmi1 avx2 smep bmi2 erms invpcid xsaveopt dtherm ida arat pln pts md_clear flush_l1d
bugs : cpu_meltdown spectre_v1 spectre_v2 spec_store_bypass l1tf mds swapgs itlb_multihit
bogomips : 5586.43
clflush size : 64
cache_alignment : 64
address sizes : 39 bits physical, 48 bits virtual
power management:

Thanks for your rep!

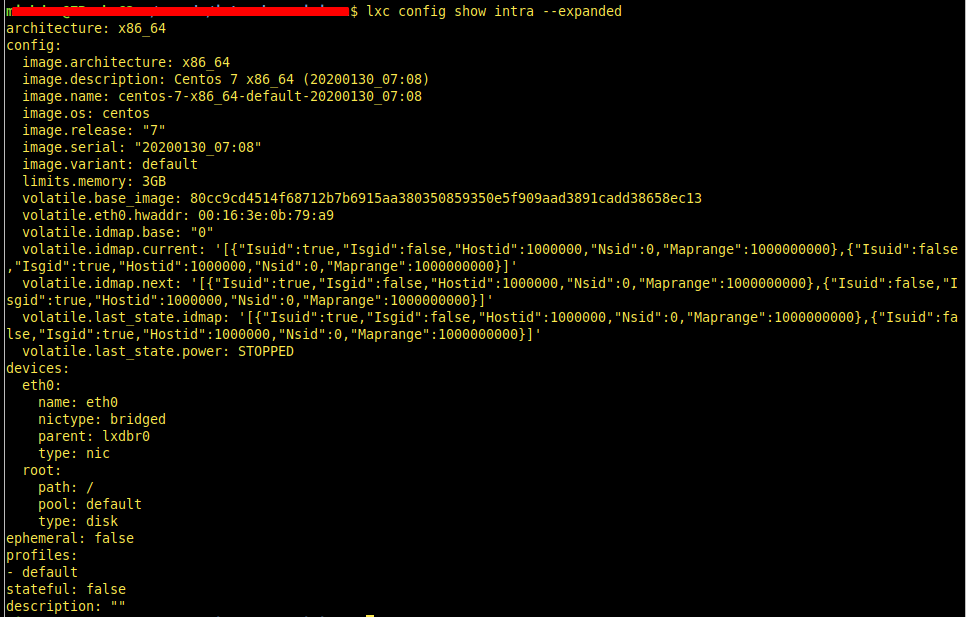
The config you posted seems to suggest you are running this in an LXD container, as I see no qemu ID key and the output of /proc/cpuinfo doesn’t show a single virtualised CPU core (as is the default without specifying it in the config). Also the image is showing as centos 7, which we do not have a VM image for yet.

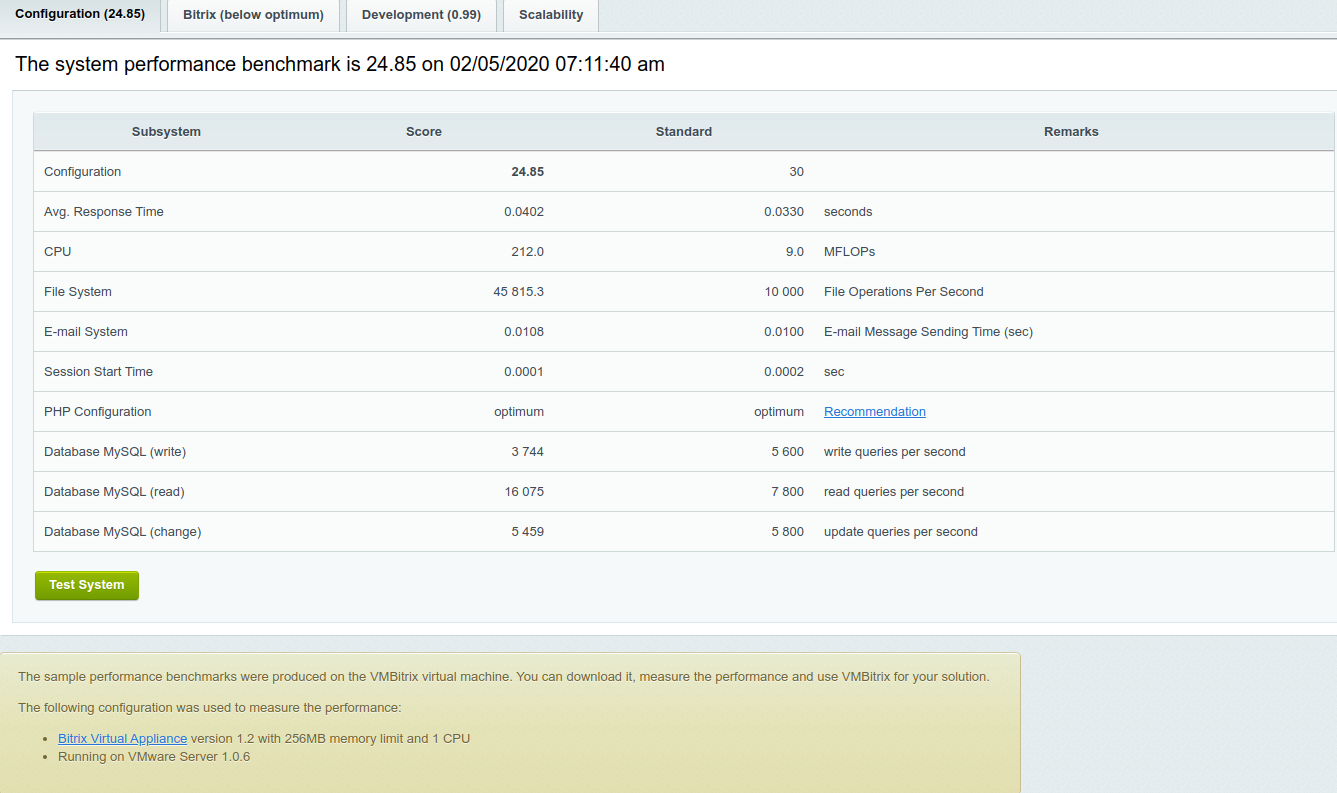
So just to confirm you are asking for why the performance monitor apparently runs better in a virtualbox VM than a LXD container?

1 Like

I cant find the reference immediately. But I read a couple of years ago that the numbers from Virtualbox’s guest always show inflated values but the ‘real-world’ performance is NOT as good as the numbers indicate. They are moderate.

Ideally you install plain Ubuntu/Centos or whatever in different hypervisors or vms and then run real WORLD programs to test.

Also if you just downloaded the vdi or ova or img from Bitrix - it may perform depending on the setup of the image.

1 Like

Yes, I am using an LXD container (centos 7). My guess is that cpu is not virtualized like virtualbox did. Is there a way to set up cpu solely for containers or virtualization like vms.

P/s: Exactly! I’m asking for why the performance monitor apparently runs better in a virtualbox VM than a LXC container?

Do you know how that score is derived? That may give a clue as to the difference. Do your applications actually run slower?

I don’t know how that score is derived. But my application actually run much slower

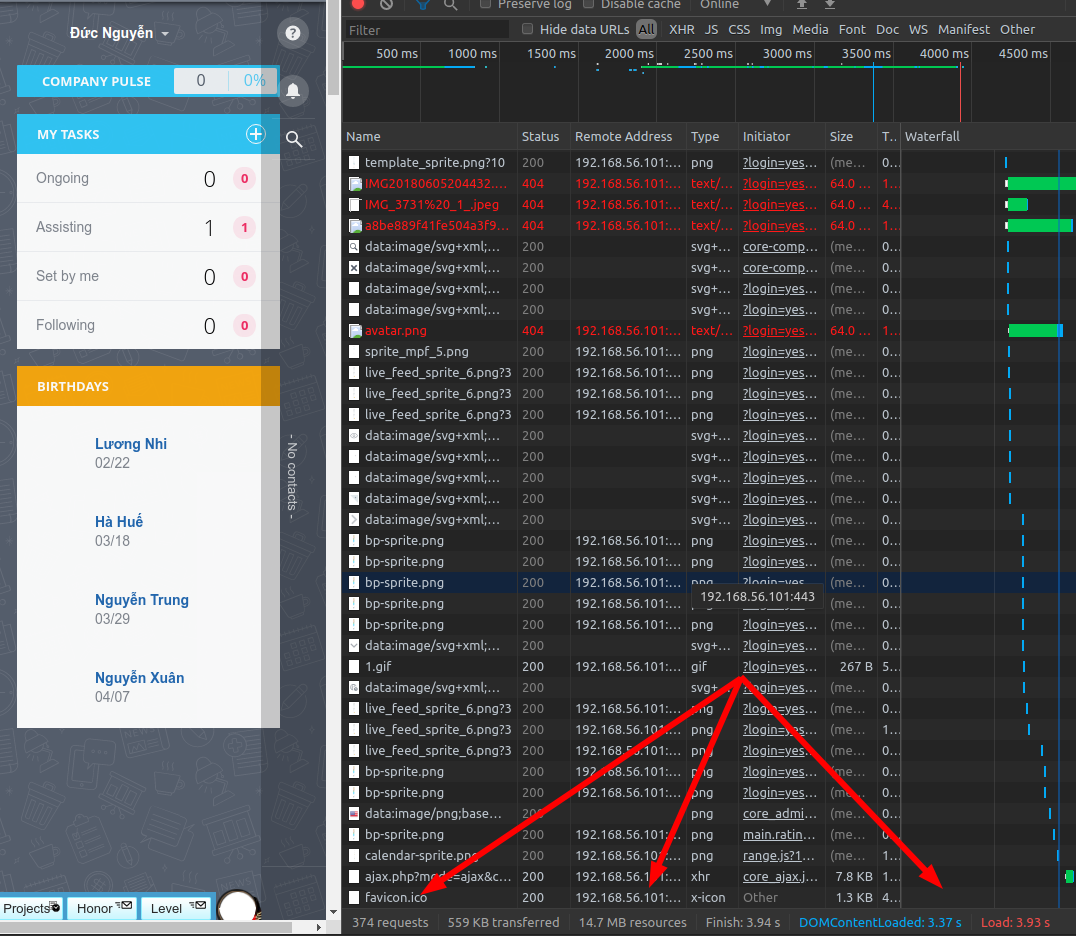
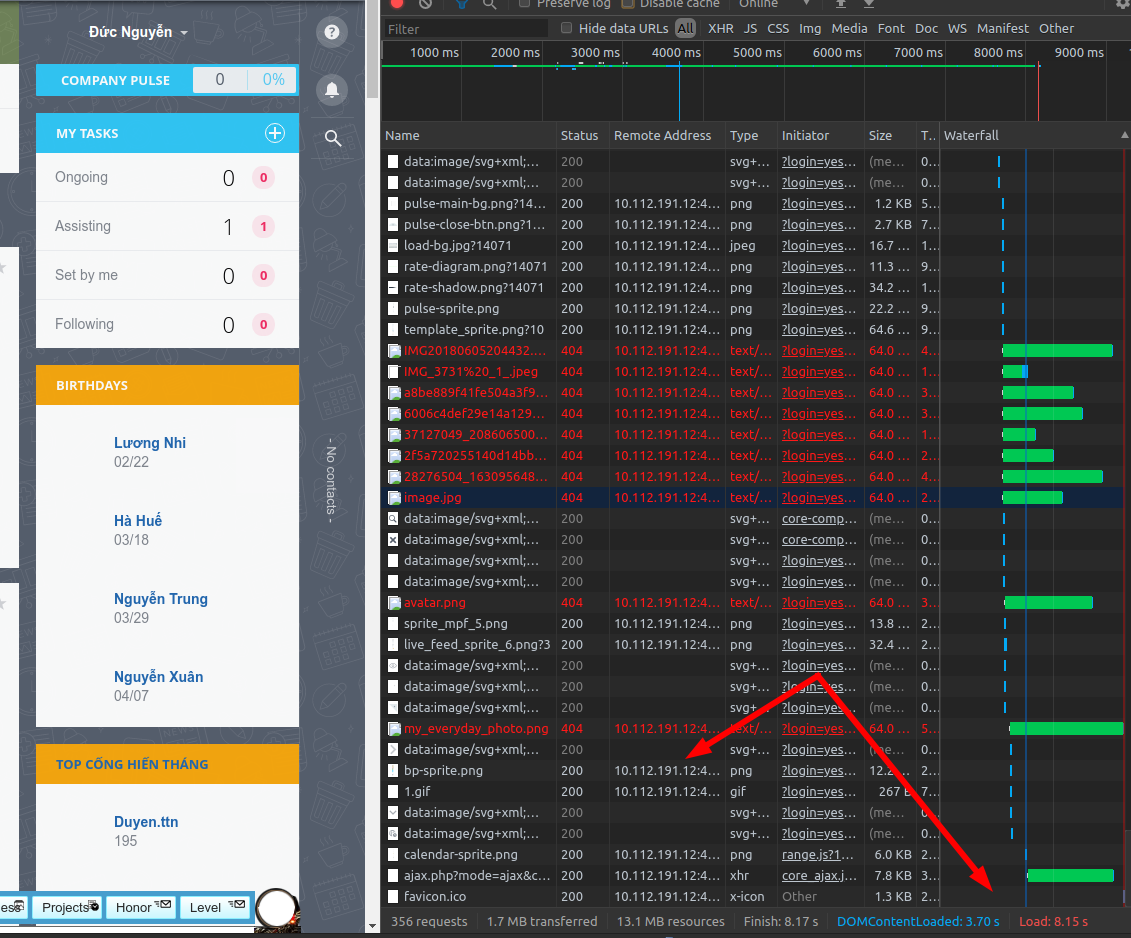
I’m not entirely sure how to interpret those screen shots, or the multipronged arrows, however I can see from those that the first one took 3.93s and the second one took 8.15s to load. However looking at those, the first one transferred 0.5MB (559KB) of data and the second one transferred 1.7MB of data, so there are some large differences in the work or data transfer that is taking place meaning they are not necessarily comparable (is there some caching going on for the first request that means it may look like it takes less time than it actually does)?

1 Like