Hi,
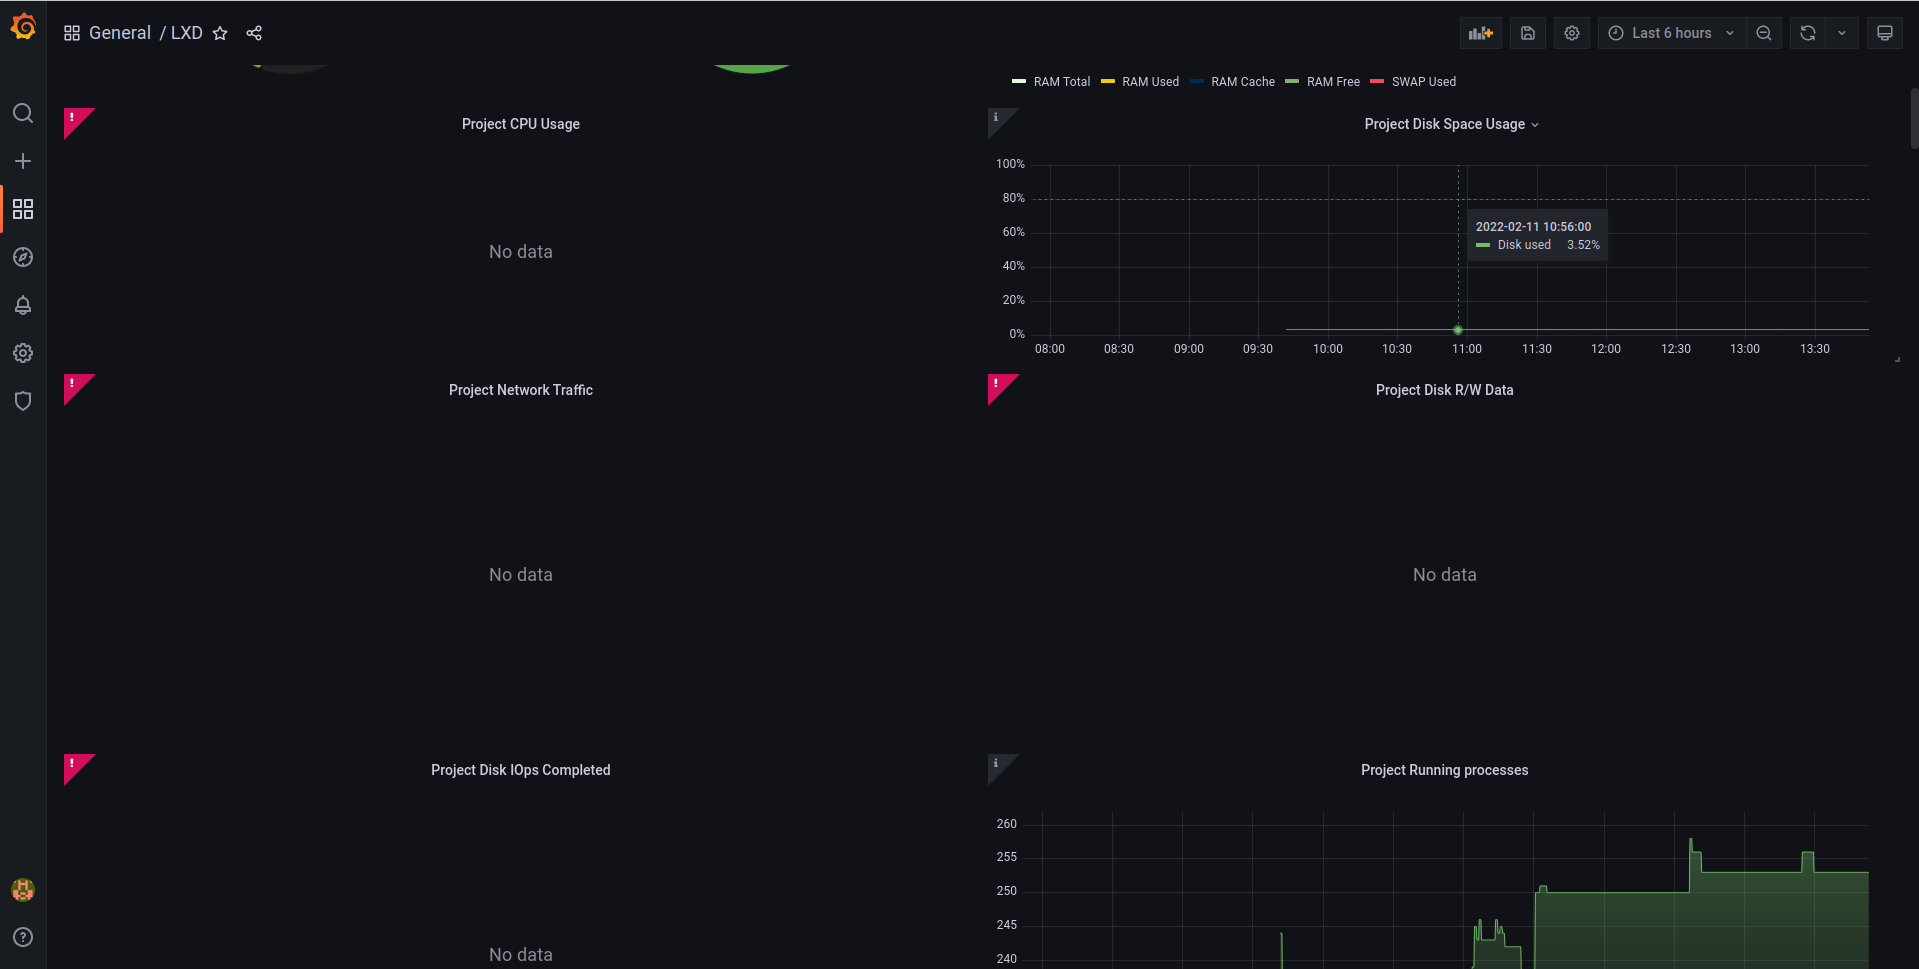
I have just tested the lxd dashboard from Grafana Labs which is 15726 but I get the mentioned error in the topic. Here is the screenshot of the dashboard. Someone any idea where can i look for the error.
Regards.
Maybe @monstermunchkin or @sdeziel can help here?
Could you please provide us with the metrics from LXD? Just run lxc query /1.0/metrics for that. And could you also show us the prometheus config?
Here are the outputs.
Regards.
indiana@mars:~$ more /etc/prometheus/prometheus.yml
scrape_configs:
  - job_name: lxd
    tls_config:
            #      ca_file: 'tls/lxd.crt'
      insecure_skip_verify: true
      key_file: 'tls/metrics.key'
      cert_file: 'tls/metrics.crt'
    static_configs:
      - targets: ['127.0.0.1:1234']
    metrics_path: '/1.0/metrics'
    scheme: 'https'
indiana@mars:~$ lxc query /1.0/metrics | grep -i -w glp
lxd_cpu_seconds_total{cpu="1",mode="system",name="glp",project="default",type="container"} 5
lxd_cpu_seconds_total{cpu="1",mode="user",name="glp",project="default",type="container"} 118
lxd_cpu_seconds_total{cpu="2",mode="system",name="glp",project="default",type="container"} 4
lxd_cpu_seconds_total{cpu="2",mode="user",name="glp",project="default",type="container"} 110
lxd_cpu_seconds_total{cpu="3",mode="system",name="glp",project="default",type="container"} 4
lxd_cpu_seconds_total{cpu="3",mode="user",name="glp",project="default",type="container"} 109
lxd_cpu_seconds_total{cpu="4",mode="system",name="glp",project="default",type="container"} 0
lxd_cpu_seconds_total{cpu="4",mode="user",name="glp",project="default",type="container"} 0
lxd_cpu_seconds_total{cpu="5",mode="system",name="glp",project="default",type="container"} 0
lxd_cpu_seconds_total{cpu="5",mode="user",name="glp",project="default",type="container"} 0
lxd_cpu_seconds_total{cpu="6",mode="system",name="glp",project="default",type="container"} 0
lxd_cpu_seconds_total{cpu="6",mode="user",name="glp",project="default",type="container"} 0
lxd_cpu_seconds_total{cpu="7",mode="system",name="glp",project="default",type="container"} 0
lxd_cpu_seconds_total{cpu="7",mode="user",name="glp",project="default",type="container"} 0
lxd_cpu_seconds_total{cpu="0",mode="system",name="glp",project="default",type="container"} 5
lxd_cpu_seconds_total{cpu="0",mode="user",name="glp",project="default",type="container"} 119
lxd_filesystem_avail_bytes{device="zpool/containers/glp",fstype="zfs",mountpoint="/",name="glp",project="default"} 4.67668697088e+11
lxd_filesystem_free_bytes{device="zpool/containers/glp",fstype="zfs",mountpoint="/",name="glp",project="default"} 4.67668697088e+11
lxd_filesystem_size_bytes{device="zpool/containers/glp",fstype="zfs",mountpoint="/",name="glp",project="default"} 4.6854701056e+11
lxd_memory_Active_anon_bytes{name="glp",project="default",type="container"} 204800
lxd_memory_Active_file_bytes{name="glp",project="default",type="container"} 1.44420864e+08
lxd_memory_Active_bytes{name="glp",project="default",type="container"} 1.44625664e+08
lxd_memory_Cached_bytes{name="glp",project="default",type="container"} 3.3548288e+08
lxd_memory_Dirty_bytes{name="glp",project="default",type="container"} 151552
lxd_memory_Inactive_anon_bytes{name="glp",project="default",type="container"} 1.22064896e+08
lxd_memory_Inactive_file_bytes{name="glp",project="default",type="container"} 2.009088e+08
lxd_memory_Inactive_bytes{name="glp",project="default",type="container"} 3.22973696e+08
lxd_memory_Mapped_bytes{name="glp",project="default",type="container"} 1.40230656e+08
lxd_memory_MemAvailable_bytes{name="glp",project="default",type="container"} 8.31164416e+08
lxd_memory_MemFree_bytes{name="glp",project="default",type="container"} 4.95681536e+08
lxd_memory_MemTotal_bytes{name="glp",project="default",type="container"} 9.9999744e+08
lxd_memory_RSS_bytes{name="glp",project="default",type="container"} 1.3211648e+08
lxd_memory_Shmem_bytes{name="glp",project="default",type="container"} 221184
lxd_memory_Swap_bytes{name="glp",project="default",type="container"} 0
lxd_memory_Unevictable_bytes{name="glp",project="default",type="container"} 0
lxd_memory_Writeback_bytes{name="glp",project="default",type="container"} 0
lxd_network_receive_bytes_total{device="lo",name="glp",project="default",type="container"} 1.24472121e+08
lxd_network_receive_bytes_total{device="eth0",name="glp",project="default",type="container"} 3.5988104e+07
lxd_network_receive_drop_total{device="lo",name="glp",project="default",type="container"} 0
lxd_network_receive_drop_total{device="eth0",name="glp",project="default",type="container"} 0
lxd_network_receive_errs_total{device="lo",name="glp",project="default",type="container"} 0
lxd_network_receive_errs_total{device="eth0",name="glp",project="default",type="container"} 0
lxd_network_receive_packets_total{device="lo",name="glp",project="default",type="container"} 366199
lxd_network_receive_packets_total{device="eth0",name="glp",project="default",type="container"} 51516
lxd_network_transmit_bytes_total{device="lo",name="glp",project="default",type="container"} 1.24472121e+08
lxd_network_transmit_bytes_total{device="eth0",name="glp",project="default",type="container"} 3.501193e+06
lxd_network_transmit_drop_total{device="lo",name="glp",project="default",type="container"} 0
lxd_network_transmit_drop_total{device="eth0",name="glp",project="default",type="container"} 0
lxd_network_transmit_errs_total{device="lo",name="glp",project="default",type="container"} 0
lxd_network_transmit_errs_total{device="eth0",name="glp",project="default",type="container"} 0
lxd_network_transmit_packets_total{device="lo",name="glp",project="default",type="container"} 366199
lxd_network_transmit_packets_total{device="eth0",name="glp",project="default",type="container"} 34999
lxd_procs_total{name="glp",project="default",type="container"} 86
So the metrics look good. The problem is likely with one of the PromQL queries in it, we’ll soon upload a new version of the dashboard and we’ll be looking for your feedback!
Revision 2 of the dashboard has been uploaded now.
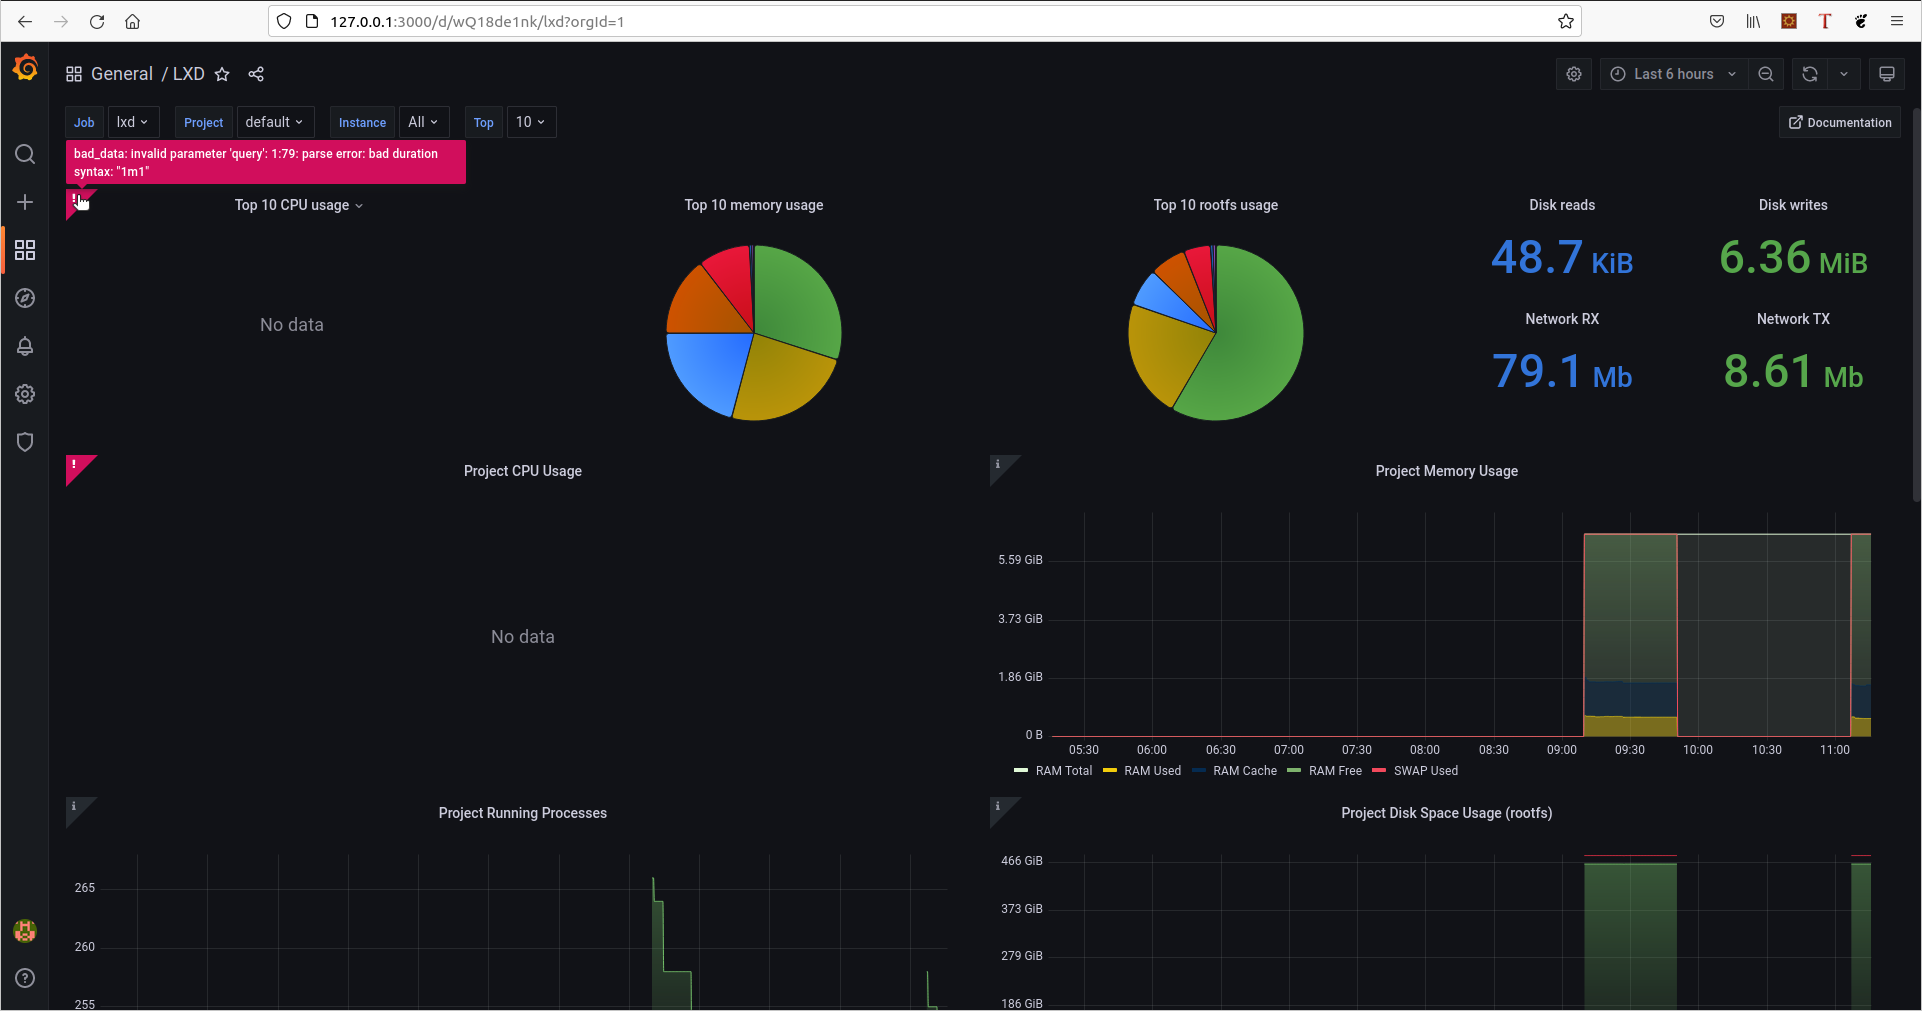
I replaced the dashboard with the new version, I get the same parse error. Here is the screenshot.
Regards.
Hmm, that’s odd.
What version of Grafana and Prometheus are you using?
Hi Stephane,
indiana@mars:~$ dpkg -l | grep -i prometheus
ii  prometheus                                 2.15.2+ds-2                              amd64        Monitoring system and time series database
ii  prometheus-node-exporter                   0.18.1+ds-2                              amd64        Prometheus exporter for machine metrics
ii  prometheus-node-exporter-collectors        0+git20200110.fc91c86-1                  all          Supplemental textfile collector scripts for Prometheus node_exporter
root@glp:~# dpkg -l | grep -i grafana
ii  grafana                                 8.3.4                                amd64        Grafana
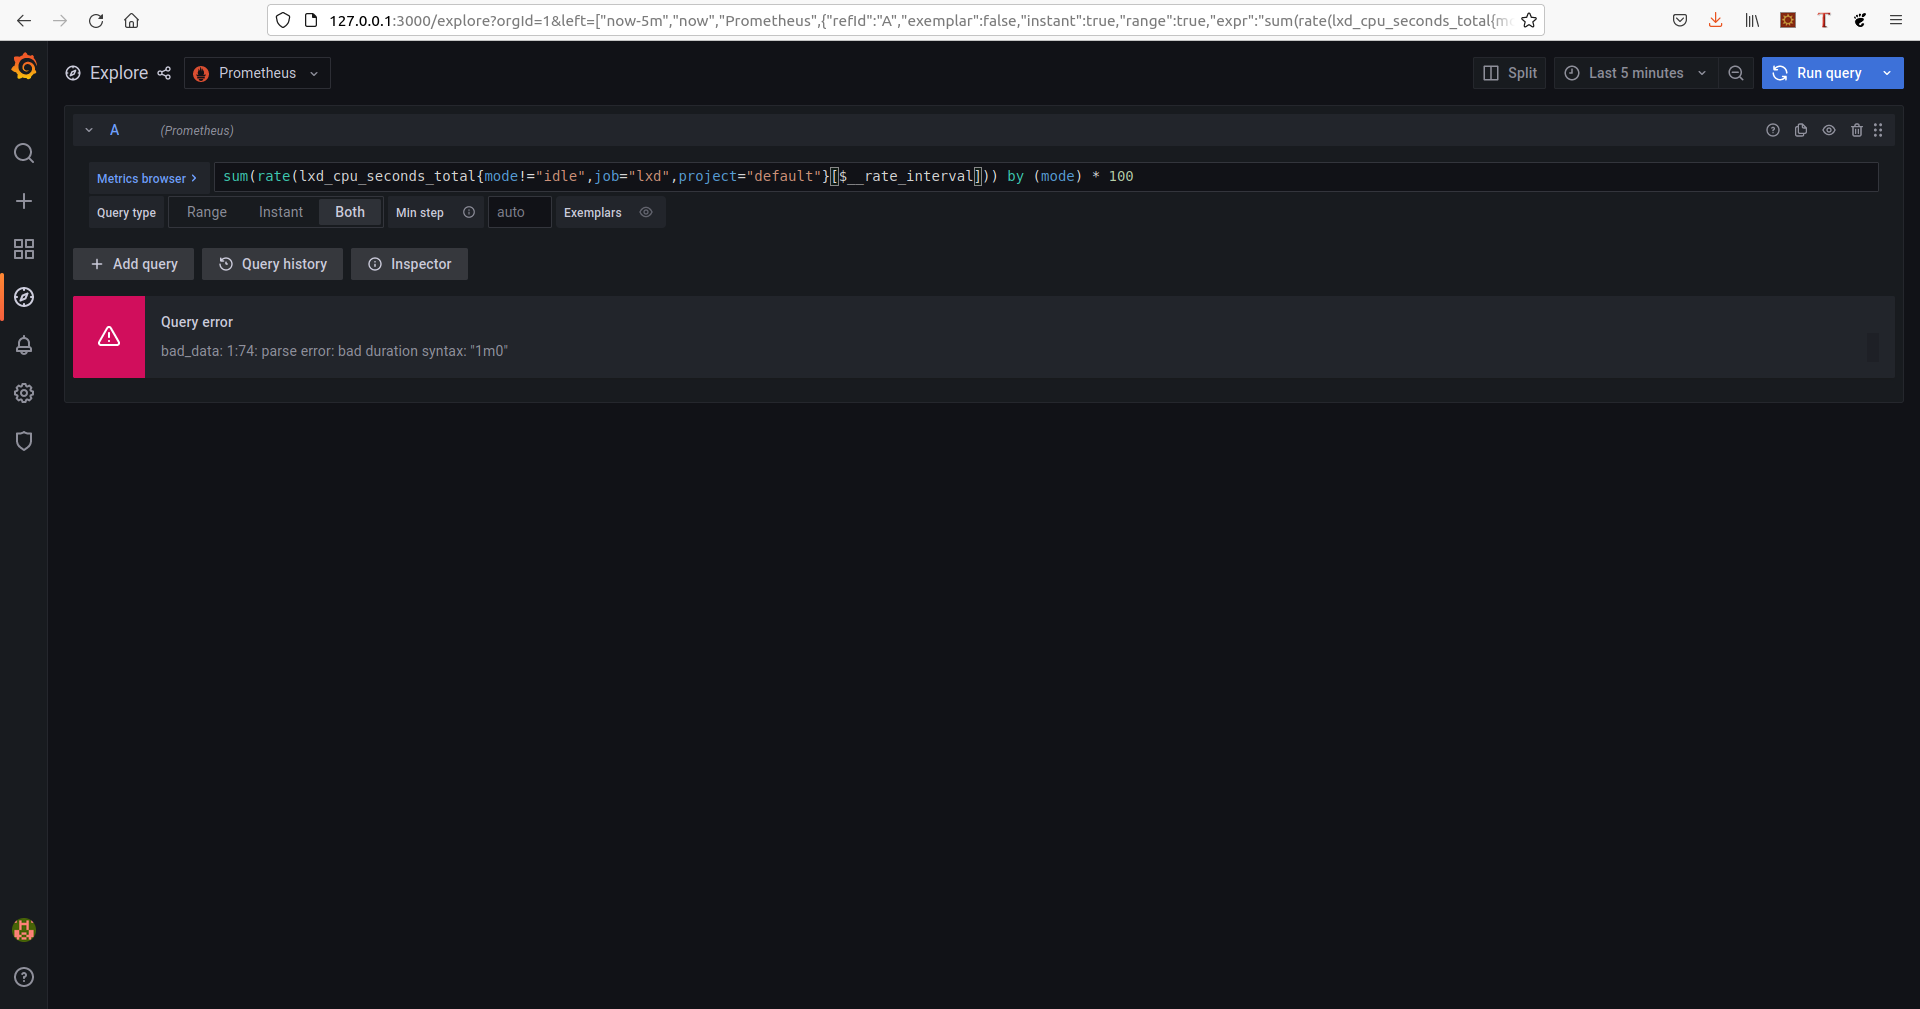
Seems to be an issue with __rate_interval on newer Grafana…
I managed to reproduce the issue here on 8.3.6, our production servers are on 8.1.1 and don’t have the issue.
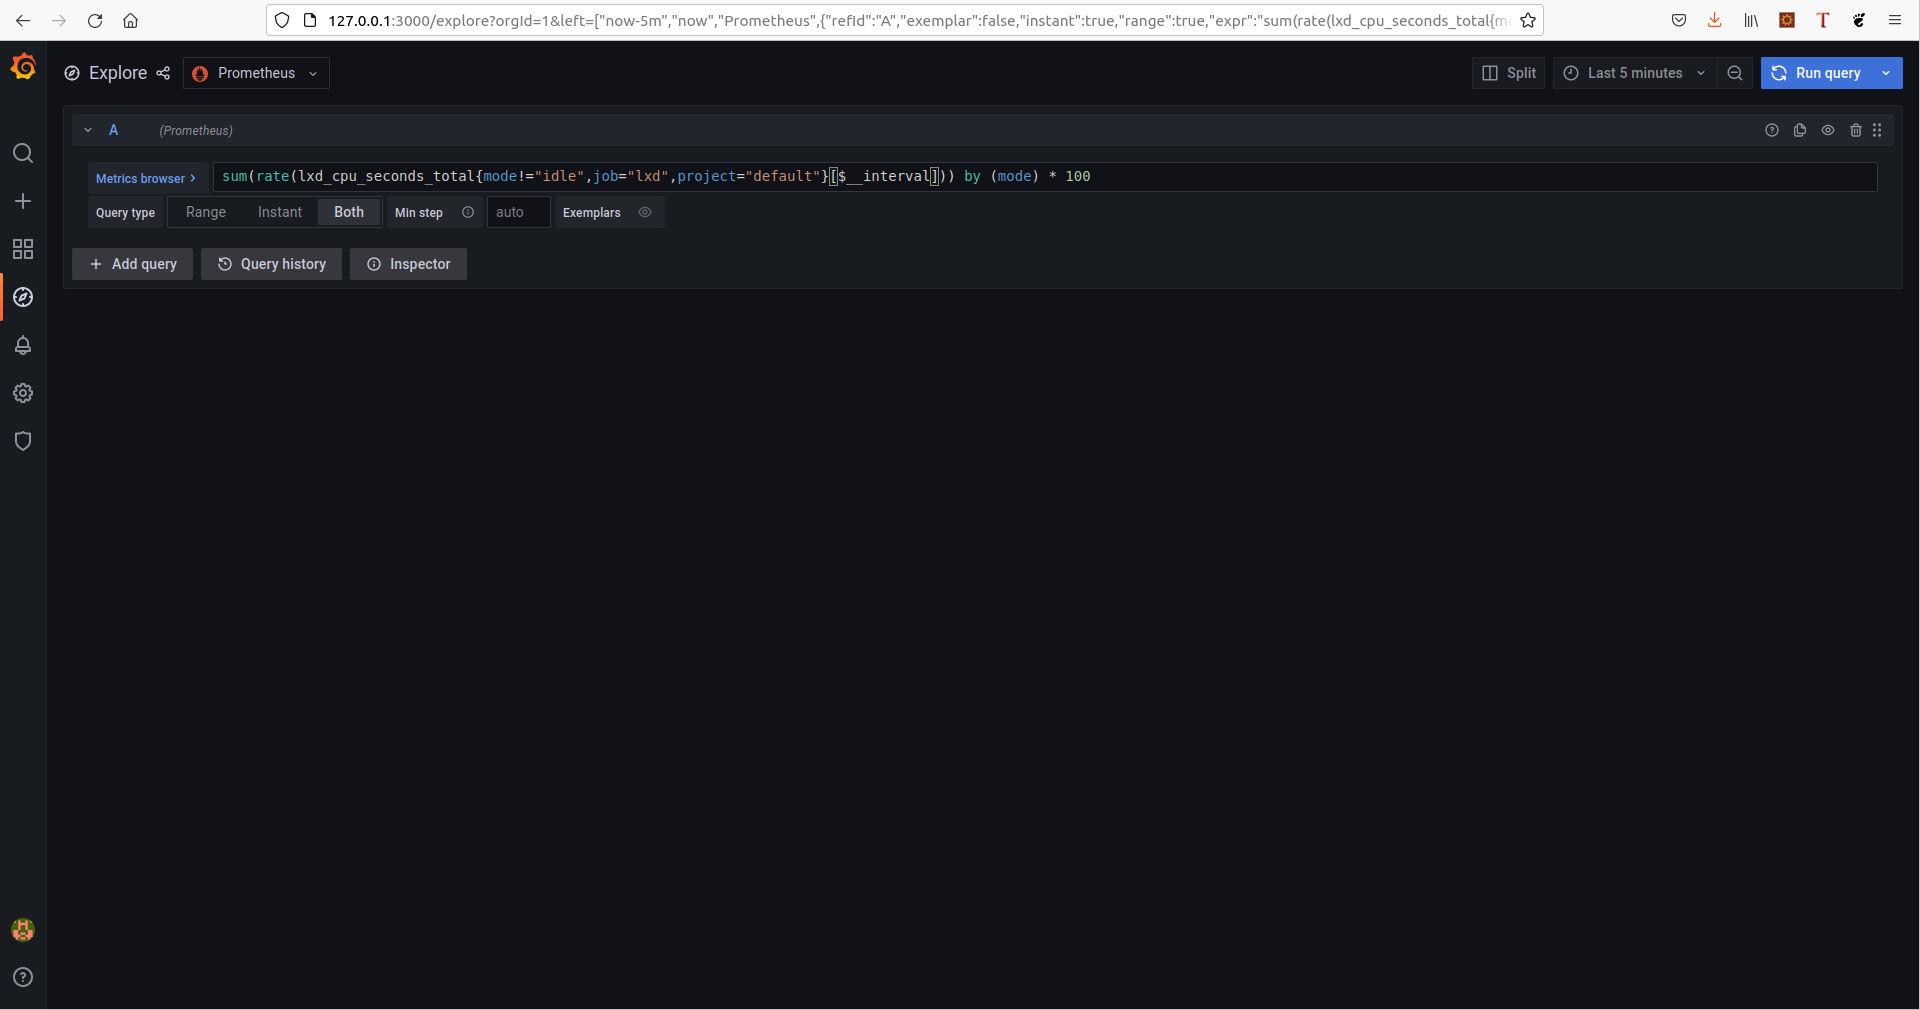
I’ll let @sdeziel investigate on Monday but a workaround is to replace the __rate_interval with __interval combined with a Min step of 1m.
https://dl.stgraber.org/lxd/grafana.json is a copy of the dashboard which I’ve modified.
Can you see if that one works for you?
Humm, when changing with __interval returns no result(no data).
Regards.
I can’t reproduce the problem with the dashboard from https://grafana.com/grafana/dashboards/15726 (rev 2). I’m using grafana 8.3.6/prometheus 2.32.1.
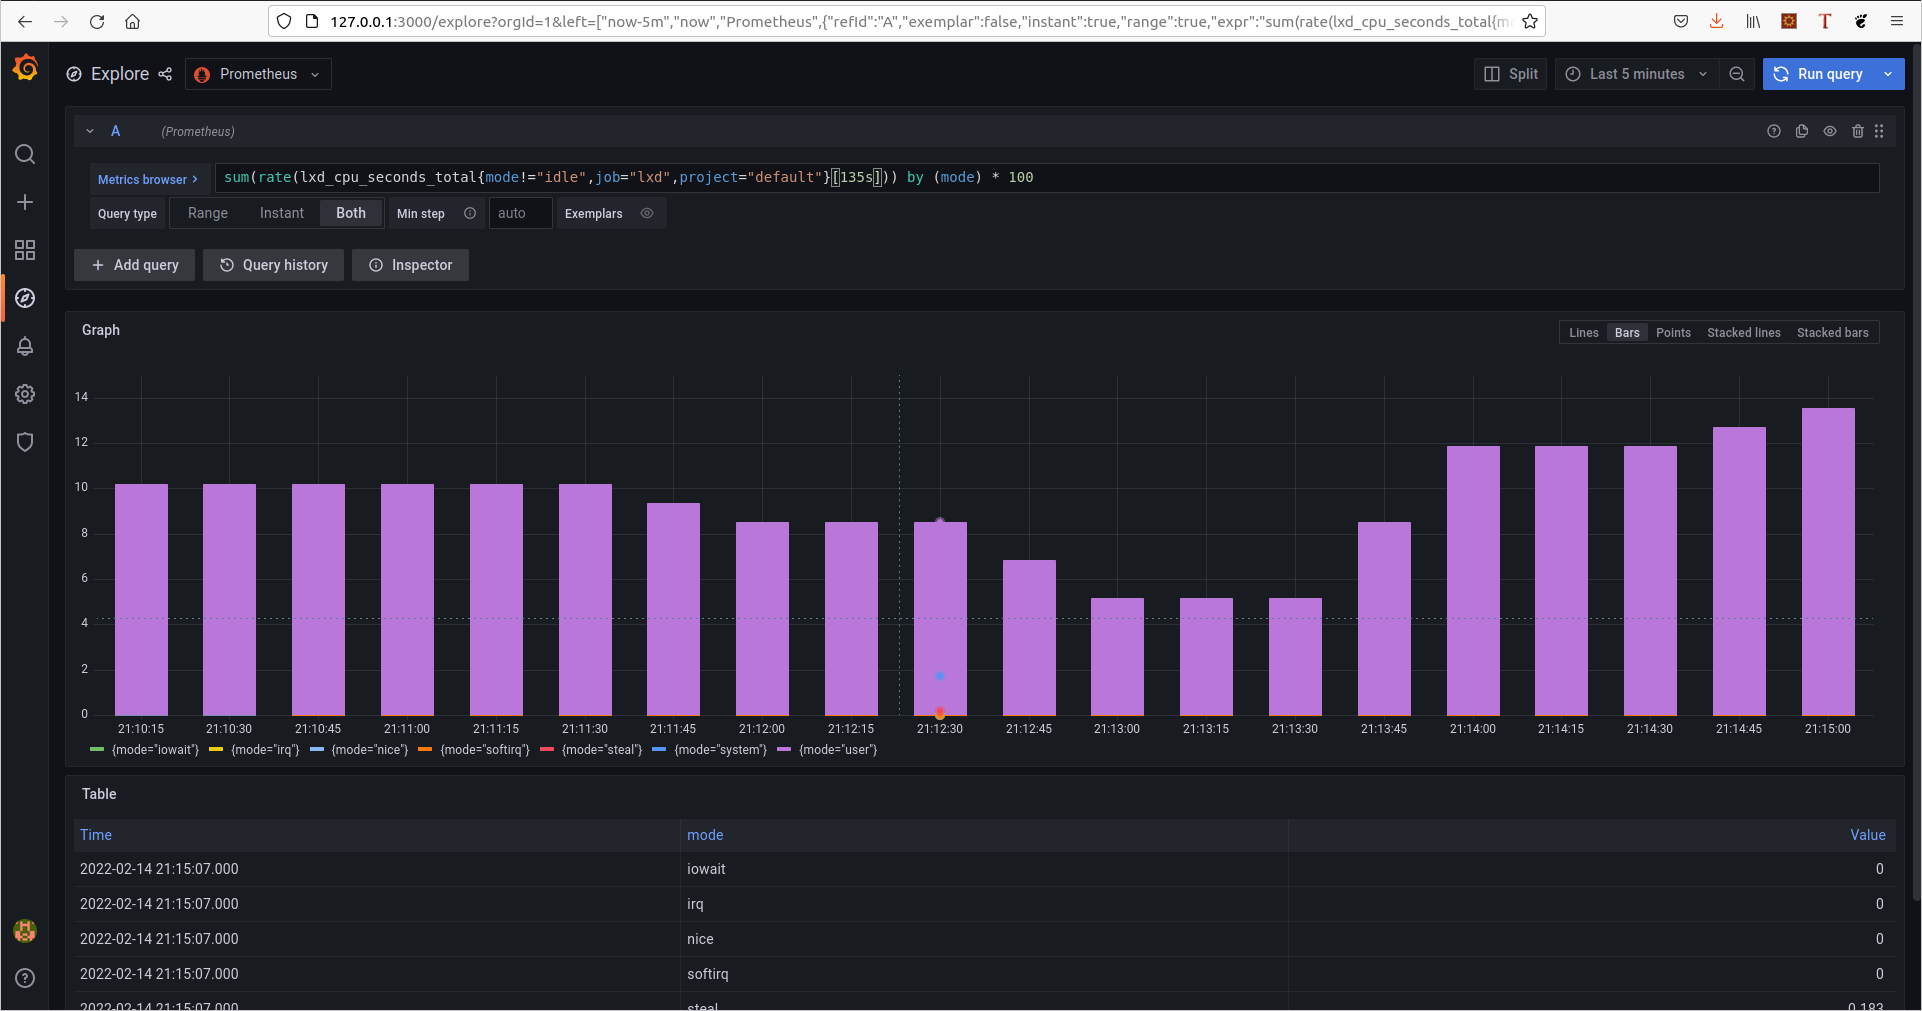
Would you be able to edit the “Project CPU Usage” graph, click on the Prometheus link (underlined in red):
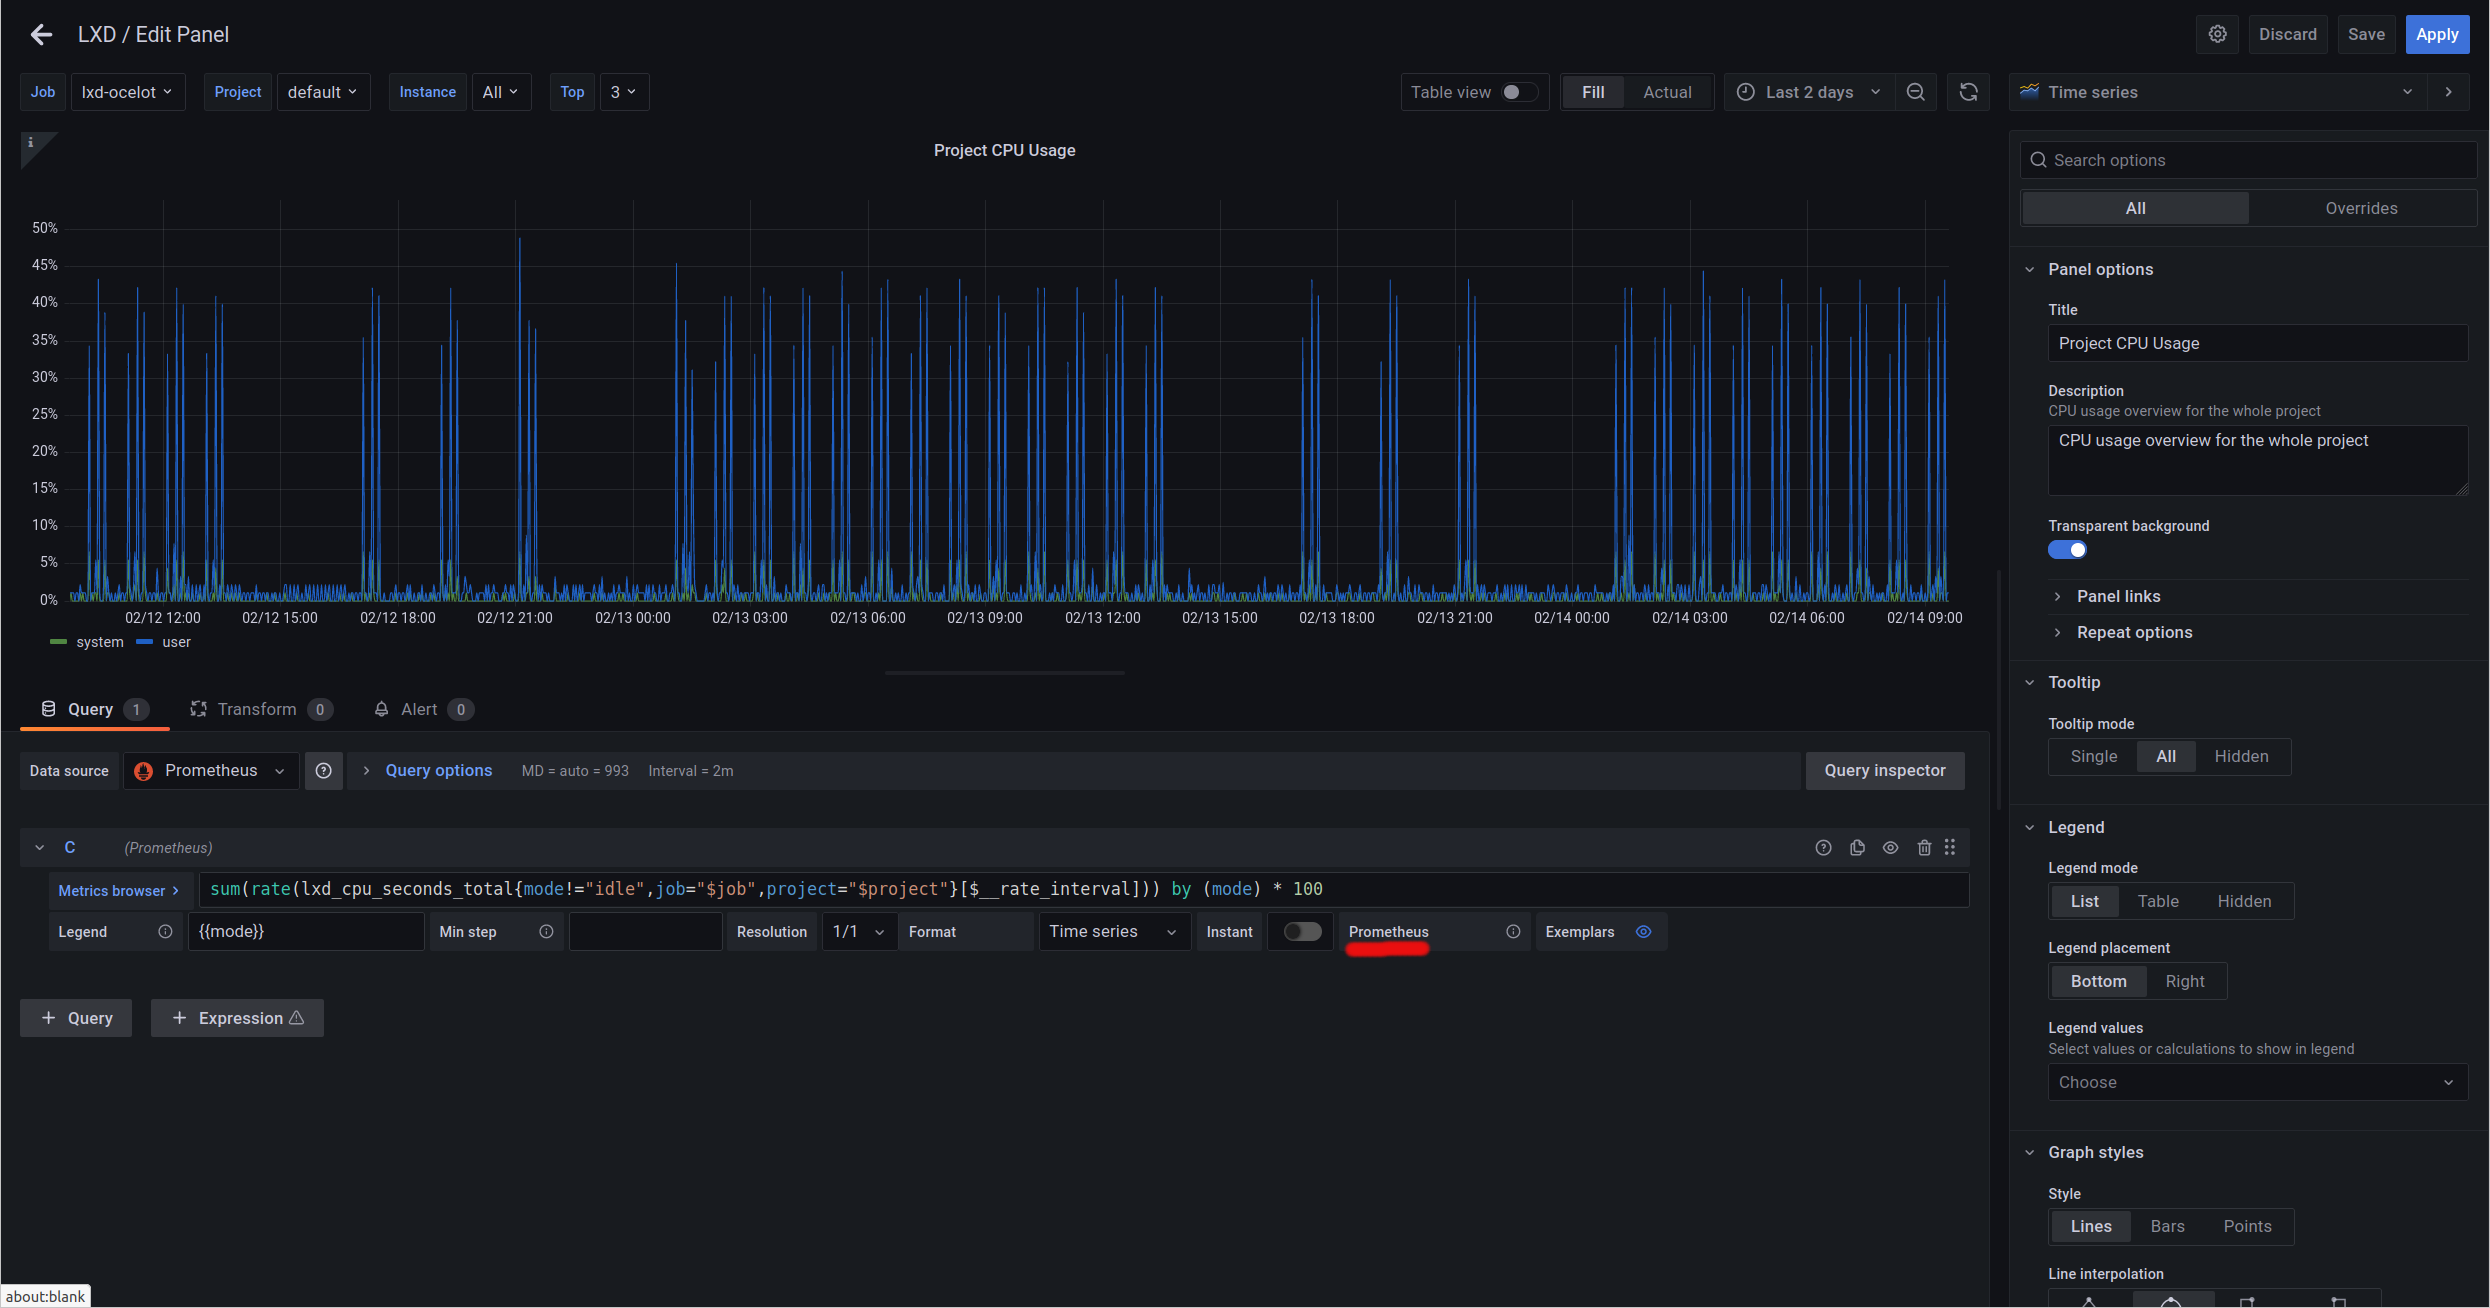
This should open Prometheus with the PromQL query crafted by Grafana. Here is what it looks like here:
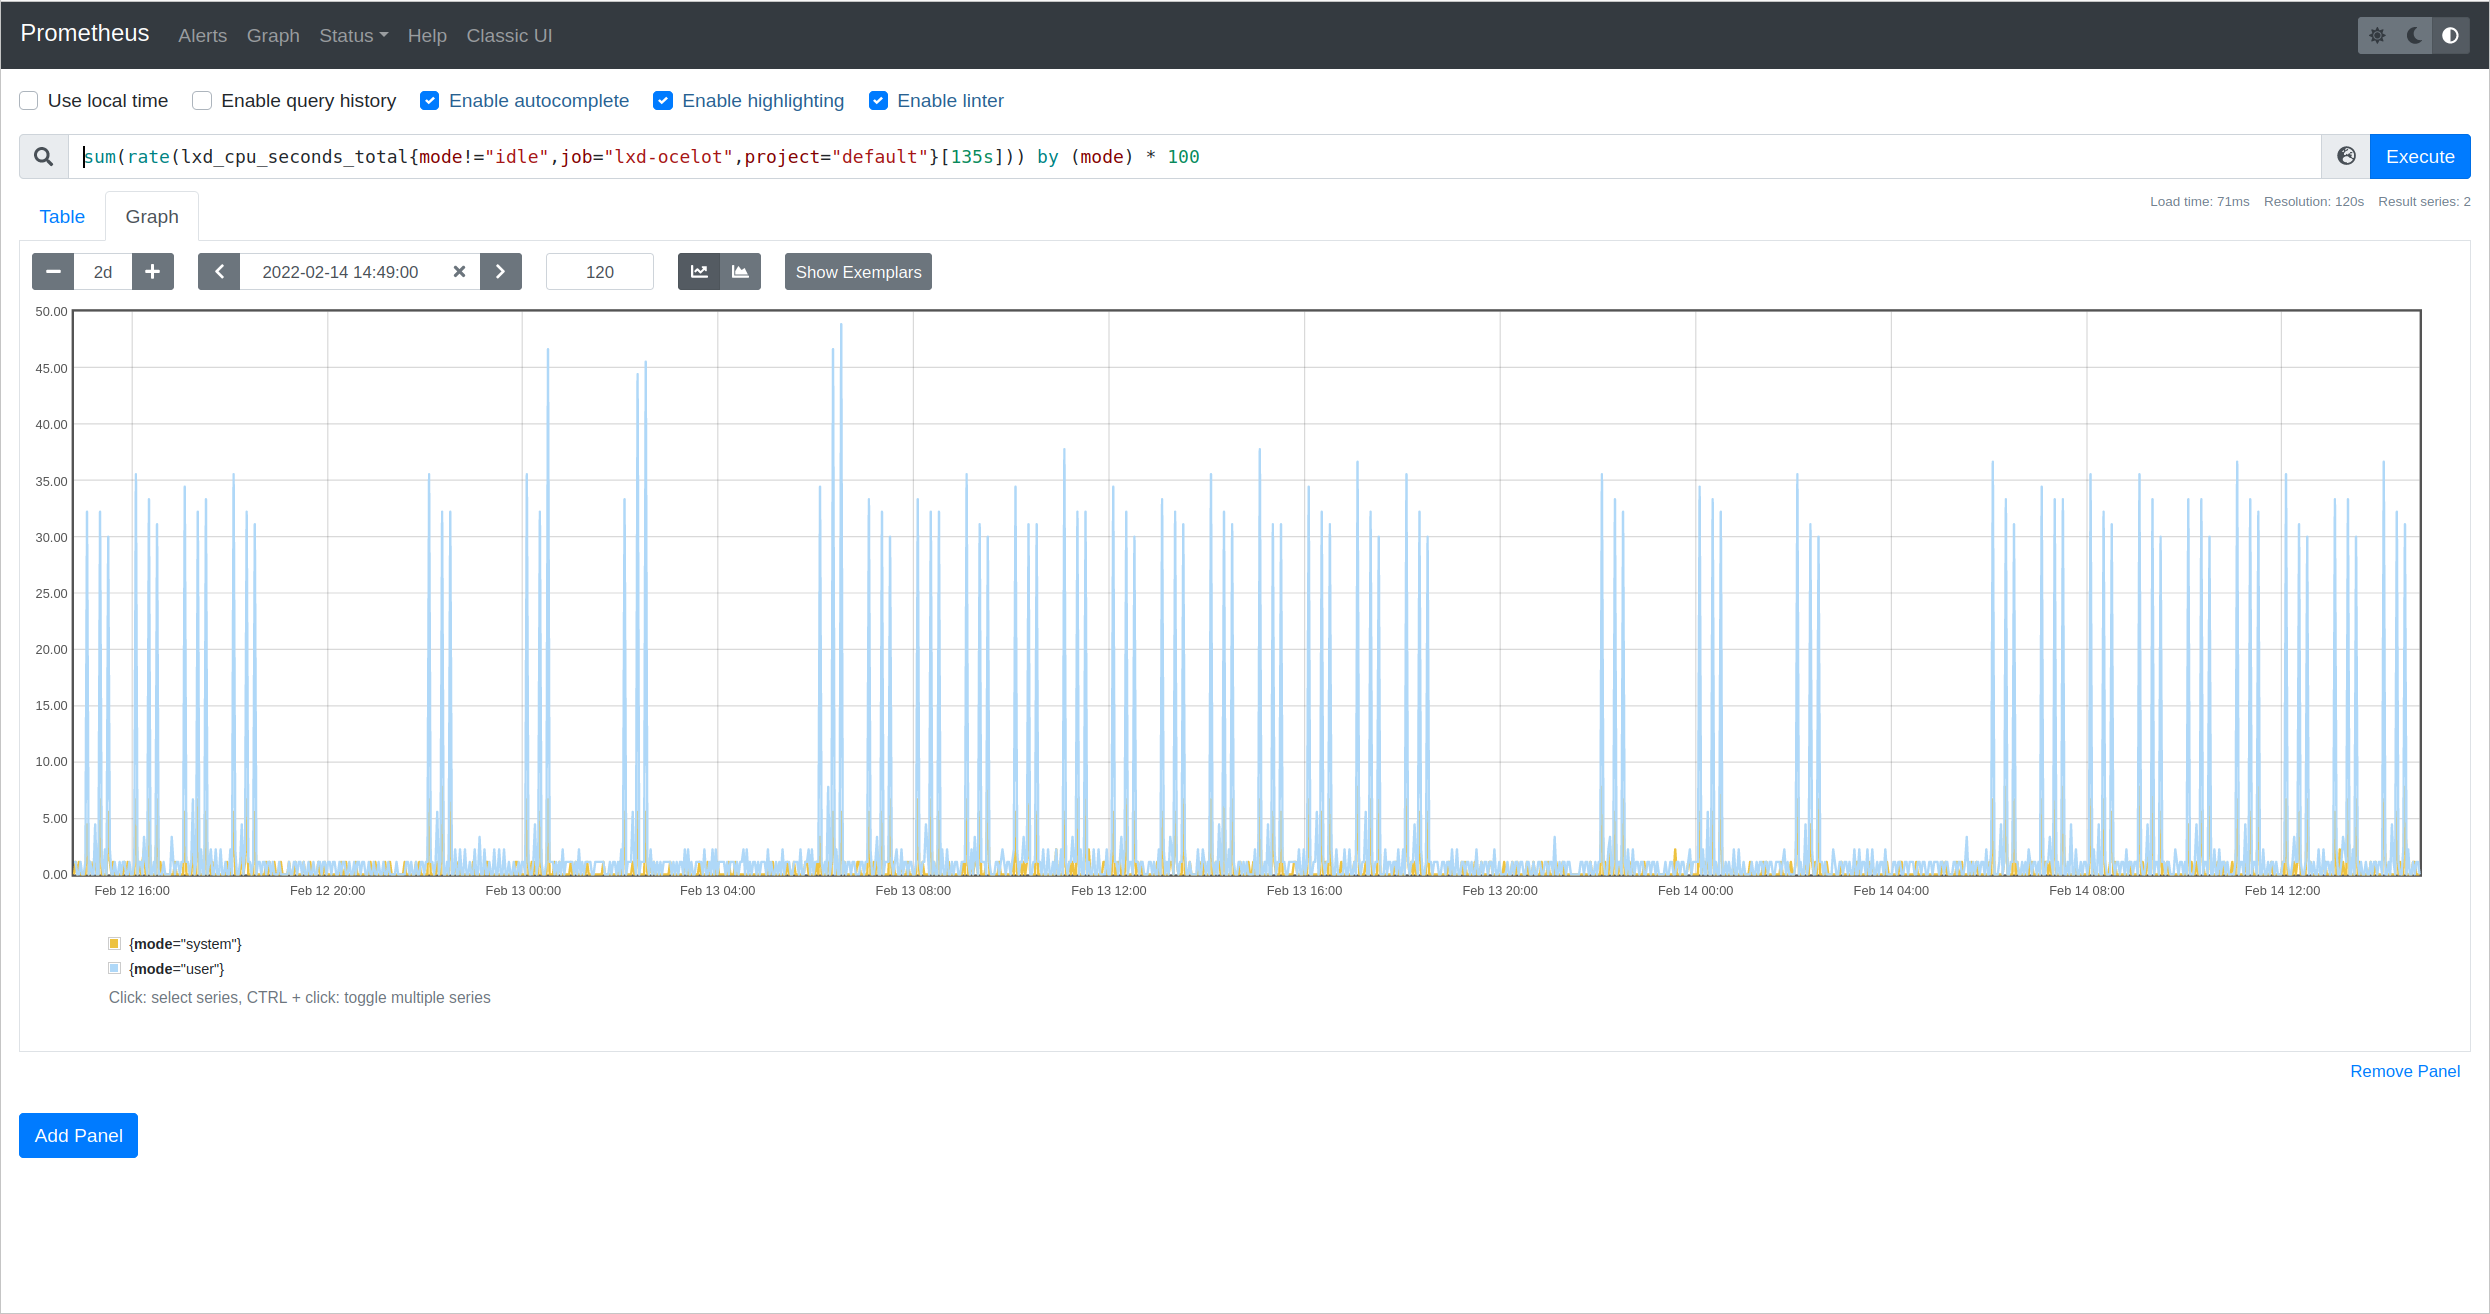
Please share what yours look like.
Since Grafana version 8.3.3 there is a compatibility issue with old versions of Prometheus (pre-v2.22.0 versions).
Ohh, nice to hear that. Thanks @qmonitoring and the LXD Team.
Regards.
We refreshed the dashboard on grafana.com, you may want to give it another try, though indeed you may also want to upgrade your prometheus to a newer version.
1 Like
Thanks a lot, Stephane for helping newbies!! It work’s actually you are right “$__rate_interval” is broken in Grafana version 8.3.4/8.4.3 it doesn’t support. We have to change to “$__interval” to debug this error.
God bless you!