I can’t reproduce the problem with the dashboard from https://grafana.com/grafana/dashboards/15726 (rev 2). I’m using grafana 8.3.6/prometheus 2.32.1.
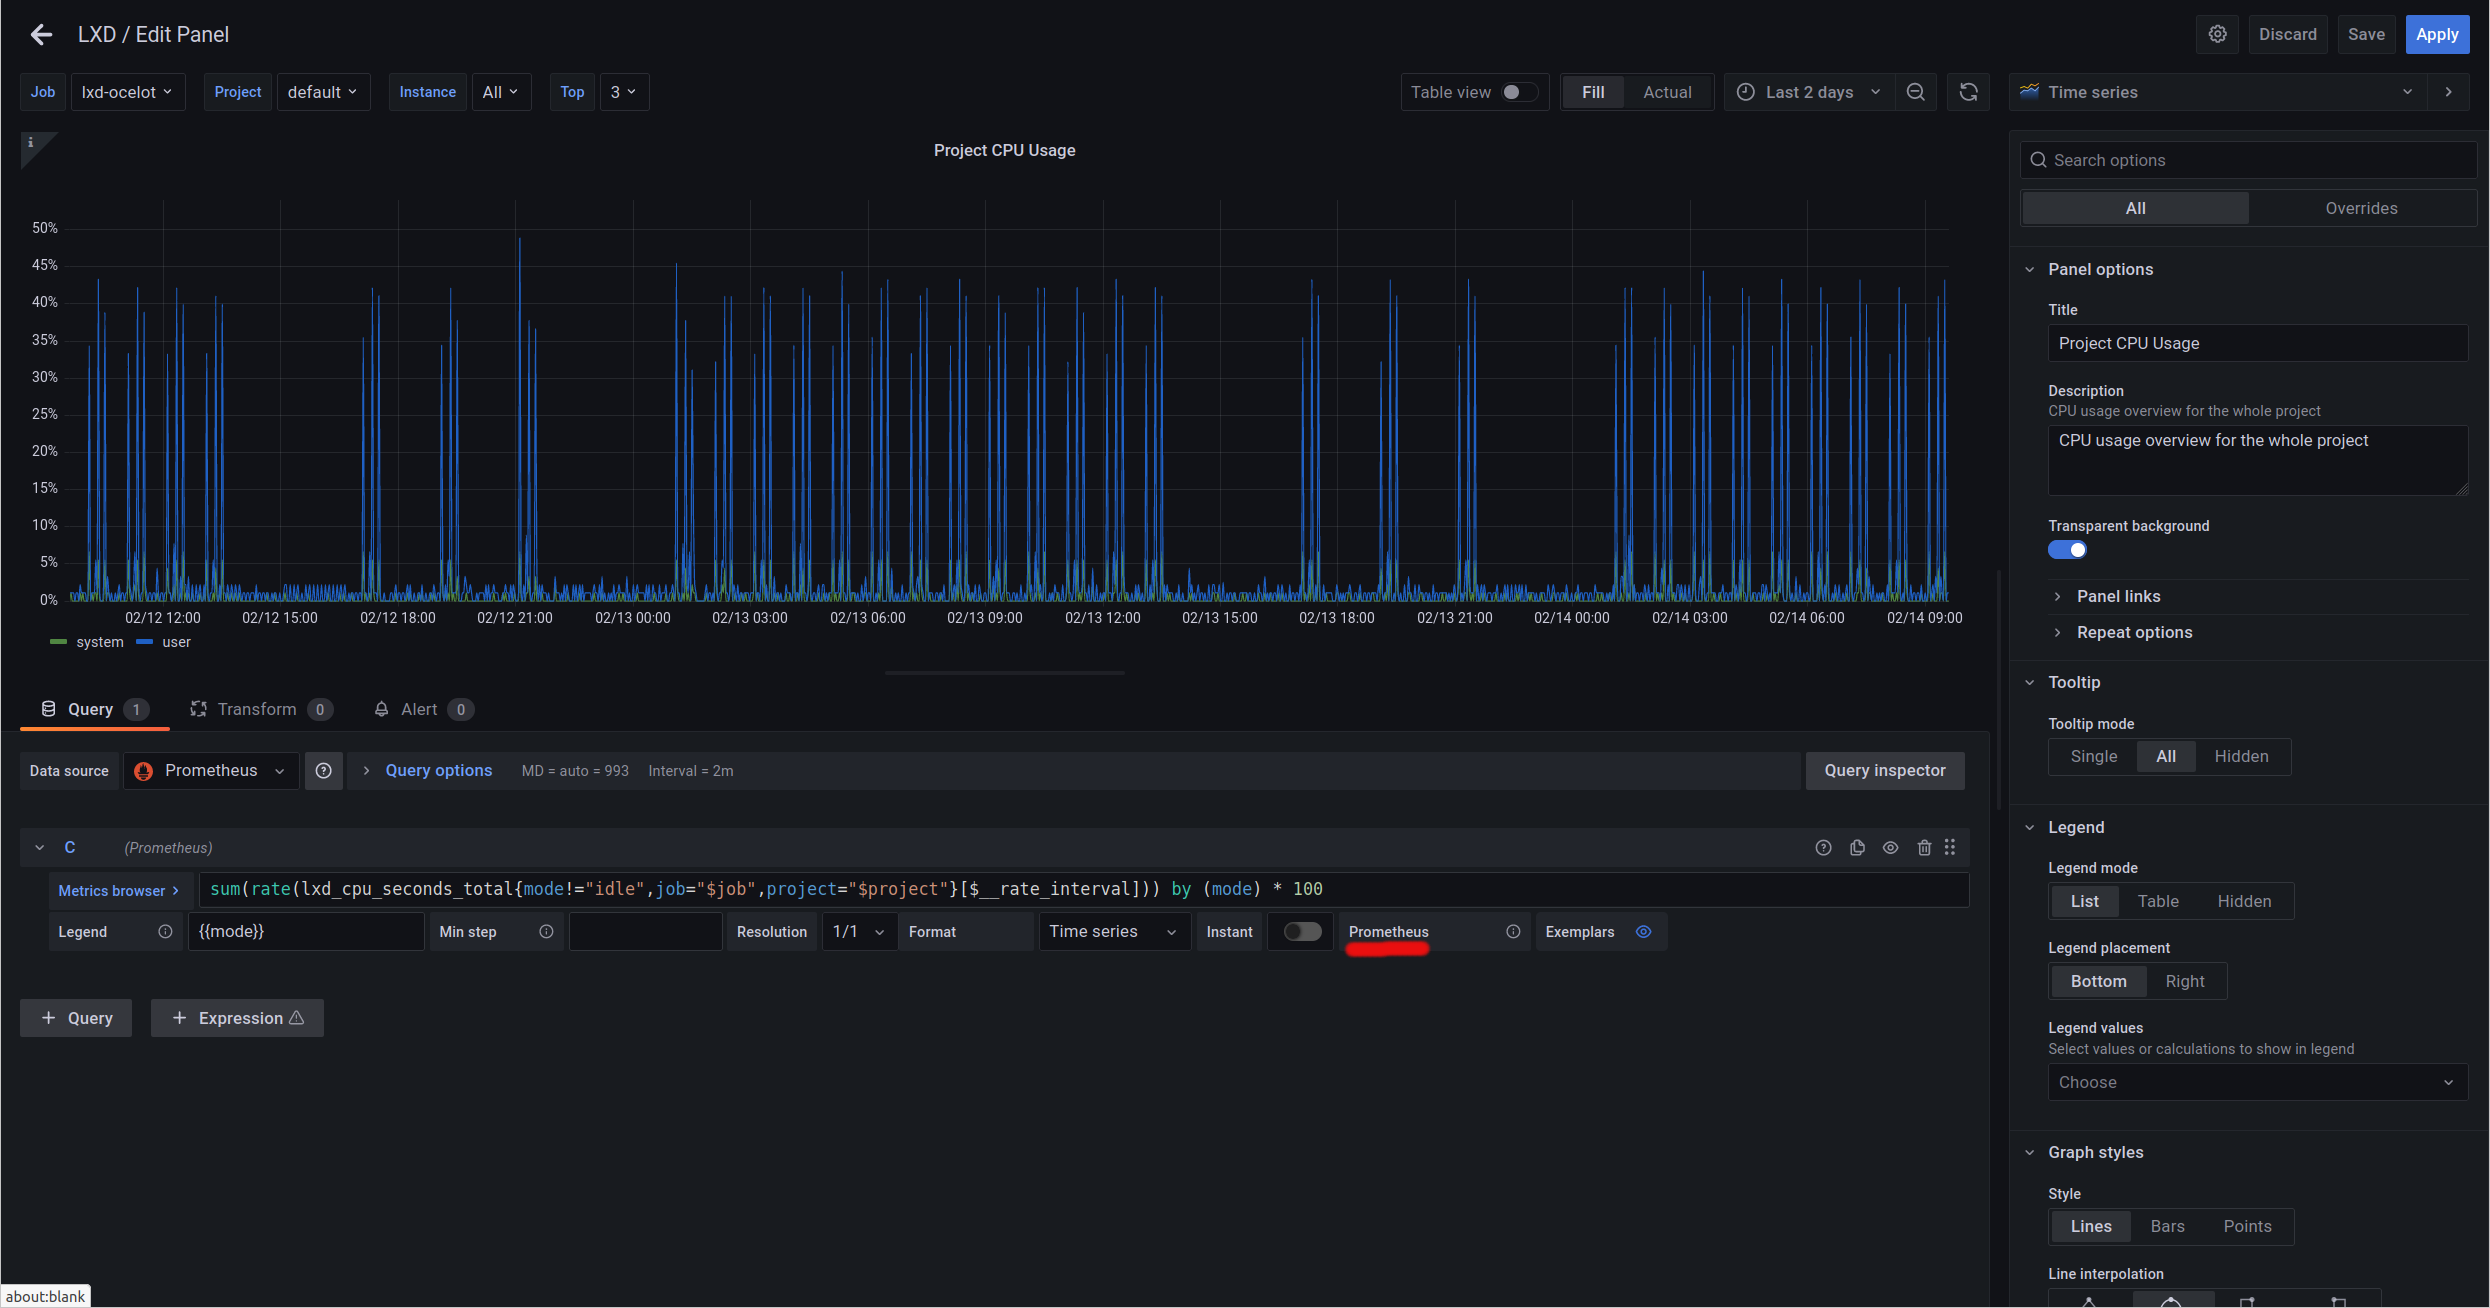
Would you be able to edit the “Project CPU Usage” graph, click on the Prometheus link (underlined in red):
This should open Prometheus with the PromQL query crafted by Grafana. Here is what it looks like here:
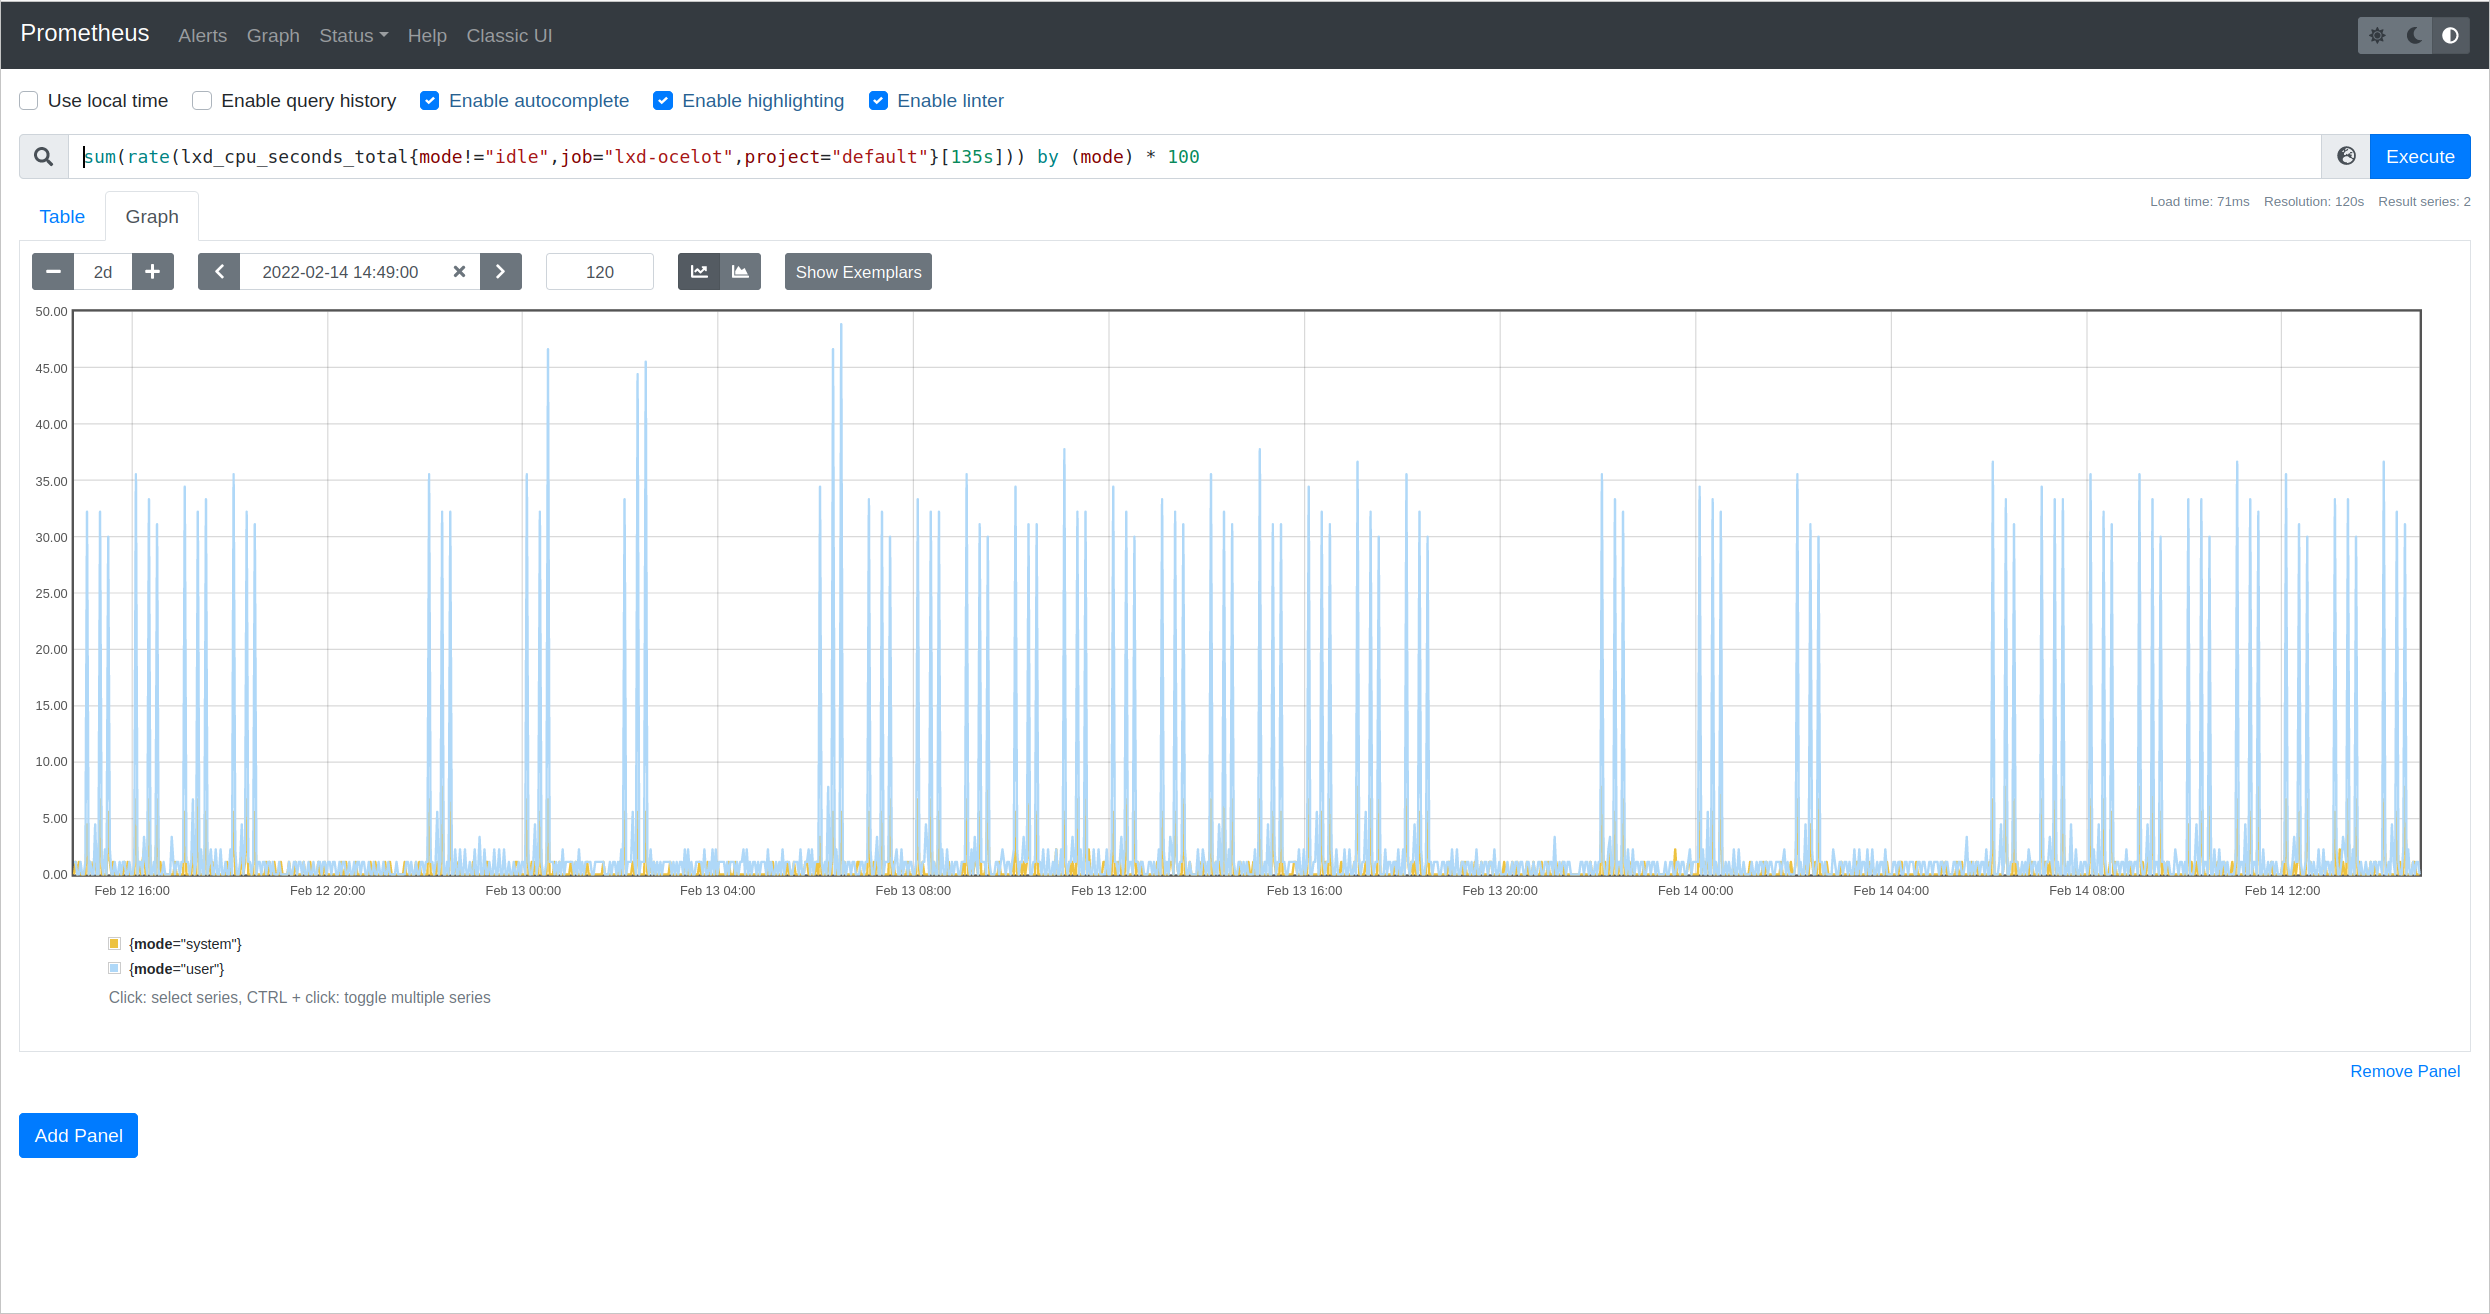
Please share what yours look like.