I can only reproduce this on CentOS 7.x containers running on a CentOS 7.6 host, running elrepo kernel 4.20.13, and using lxcfs 3.0.3, lxd 3.11.0 and lxc 3.1.0.
When running top, processes will randomly show 200% CPU, 400% CPU. I only have this issue with CentOS 7.x containers. CentOS 6.x, 5.x and Debian containers show CPU usage properly.
Also I have this issue regardless of whether I spin up a new CentOS 7.6 container via the LXD provided images, or migrate a CentOS 7.x container from openvz or a VM.
Please let me know any extra information needed to help track this down.
Sorry for the delay, but here’s some extra details.
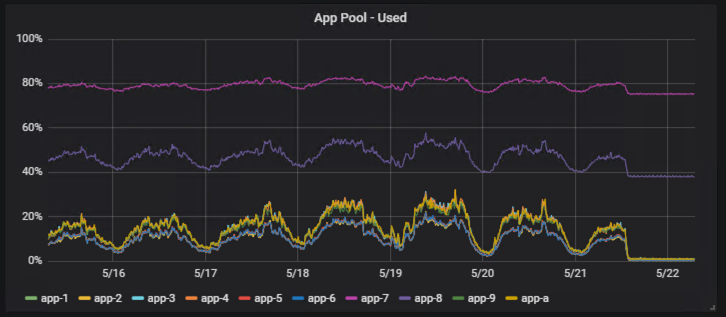
The issue is that processes are reporting might higher CPU than they’re actually using. Here’s output from graphite. app-7 and app-8 are CentOS 7.4 64bit containers running on a lxd 3.11 host, with lxcfs 3.0.3 pulled from master about 1 month ago.
Even when there’s ZERO load on the boxes, processes are reporting that they’re using more CPU then they actually are.
Here’s the output from top on app-7: https://pastebin.com/Wh5x85JQ - Even though the summary line is reporting 100% idle, java is reporting 200% used and top 100% used. Even though there’s no actual load on the box.
Here’s the output from top on a container spun up from the lxd images repo: https://pastebin.com/Whh6T7Ha - same issue, with a vanilla centos 7 container spun up from images:centos/7/amd64 - top process reporting 100% cpu, even though it’s not using it.
Here’s the output from htop on app-7: https://pastebin.com/JPhCv9dn - It does the same thing, reporting cores are fully loaded when the process is actually idle, or only using a few % of CPU, not hundreds of %.
I’ve tried building lxcfs from master today, same issue. I’ve tried building 2.0.8, and while I can trigger the same issue, it seems to happen less frequently.
I’m not sure how to debug this further. But so far, the issue only exists on CentOS 7 containers. I cannot reproduce it on CentOS 5, 6 or Debian containers.
Still the same issue of CPU utilization inside the container being incorrectly calculated, showing processes using much more CPU than in reality. This makes it difficult to monitor containers for CPU utilization.
As discussed over E-mail, I have re-produced this issue on both CentOS 7 and Ubuntu 18.04 hosts, so it seems like a general issue with lxcfs rather than a specific problem with CentOS 7 hosts.
The trick to re-producing it, as you pointed out, is to press space bar whilst inside top every couple of seconds and you will see the top process shows as 100% usage. This does not happen if lxcfs isn’t running on the host.
And if there’s actual workload going on in the container, you’ll get X00% where X is usually the number of active threads inside the process. Logstash will usually show 400% alternating between its actual usage. And as you say, not running lxcfs causes the process usage to be reported correctly.