How to monitor LXC running container metrices during migration phase

Respected all,
To start live migration using LXD in LXC my experimental setup is as follows:

Physical machine OS: Ubuntu 16.04

lxc --version 2.0.11
lxd --version 2.0.11
criu --Version: 3.9

The command to migrate container is:
sudo lxc move c1 ‘remote LXD server name’:
Containers can be successfully migrated from one host to another.

Please suggest, how to measure running container metrics like ‘downtime’, ‘network traffic’ ‘cpu’ and ‘disk utilization’. Any help will be greatly appreciated.

lxc info gets you some of the data for CPU, memory and disk (depending on the storage backend). Depending on what you’re doing, you could also get the same data directly from the API.

Note that extracting all that information is pretty costly which is why LXD only does it as it’s queried rather than attempt to keep historical values.

As for the migration downtime, the best way to figure that out is to ping your container during the migration as many things can impact the actual migration time. First there is the actual downtime during the last transfer of the filesystem and the container state, then there is the time needed to restore the tasks on the target, then there are network delays as switches learn where the MAC address of the container now is.

Thanks sir, I will try to create script for this and update soon.

Respected all,
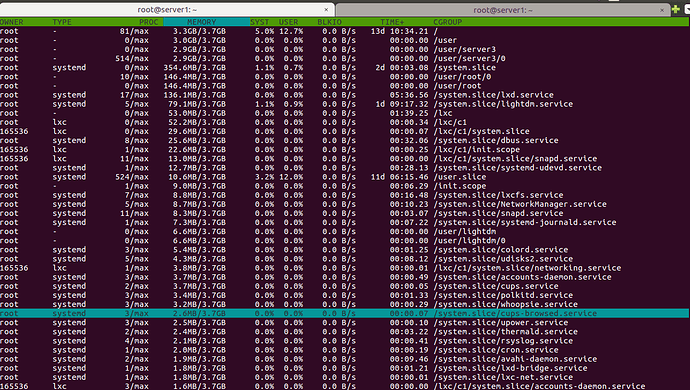
please suggest “how to measure network traffic” during container migration from one host to another. I explored ctop tool (as in attachment) but not getting desirable output.

Hi Aditya,

I think there is no support for LXC/LXD to ctop yet. How do you run ctop for LXC/LXD containers?

You need a tool that understands containers and can provide fine-grained control as to what you are measuring.
One such tool is sysdig, How to use Sysdig and Falco with LXD containers – Mi blog lah!

More examples at https://github.com/draios/sysdig/wiki/Sysdig-Examples

Respected Sir,

Earlier, I followed instructions given at https://linoxide.com/how-tos/monitor-linux-containers-performance/ , but did not got the results.

I see that there are two ctop tools,

  1. https://github.com/yadutaf/ctop/ written in Python, has support for Linux Containers.
  2. https://github.com/bcicen/ctop written in Go, no support yet for LXC/LXD.

You can try to ask at the first project which has some support for Linux Containers. You can file an issue there to ask for accumulative network traffic per container.

I think though that neither support accumulative network traffic.

Respected Sir,

these days I fully explored Sysdig tool from yours blog URL https://blog.simos.info/how-to-use-sysdig-and-falco-with-lxd-containers and https://sysdig.com/blog/let-light-sysdig-adds-container-visibility/ to monitor LXD container live migration metrics.

Others parameters measured successfully but facing problems for the CPU utilization:

  1. To measure this parameter during live migration process, I run the command:
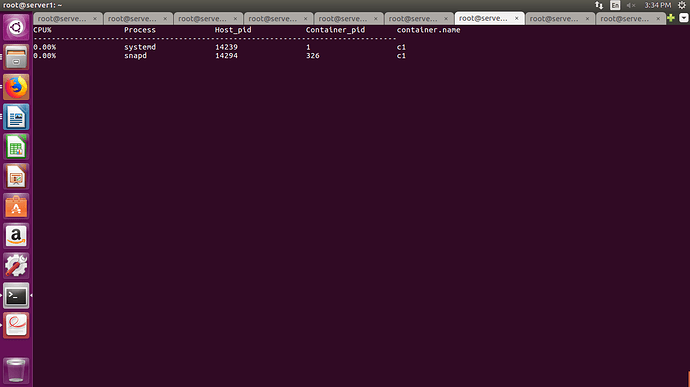
    sudo sysdig -pc -c topprocs_cpu container.name=c1
    but, each time CPU% is zero

Please, suggest how to monitor CPU utilization during container migration ?.

If CPU% remains zero, then would need to verify that the process you are checking is indeed the one that does the migration.

Reading the source code of LXD, we see that LXD spawns a child process called forkmigrate that does the actual migration.

Thanks sir, for great support.

Respected Sir,
Greetings of the day, and thanks for your kind support each time !!!

In my experimental setup workload benchmarks like (Apache web server, Geekbench, Bonnie++, Sysbench, MySQL, Postgresql, etc) are running over LXC container.

To measure network traffic during LXC container migration, as per your last post dated: July 4 I used following methods:

1. Sydig tool command:

sudo sysdig -pc -c topcontainers_net

  1. Secondly explored various studies and find the relevant one from URL: https://serverfault.com/questions/328963/centos-monitoring-traffic-on-port

sudo iftop -i lxdbr0 -P

But, the network traffic generated for each workload is very less approx (4-15 KB) range. workloads.
Please suggest a method to measure the network traffic generated during container migration.

Hi!

The topcontainers_net in sysdig is a chisel, a script that performs specific captures. Here is how chisels work in sysdig.

The following command shows the available chisels in your installation of sysdig.

sysdig --list-chisels

You can get the source code of a chisel (written in LUA) by looking in /usr/share/sysdig/chisels/.

You can view the parameters of a chisel (for example, topprocs_net) by running

$ sysdig --chisel-info topcontainers_net

Category: Net
-------------
topprocs_net    Top processes by network I/O

Sort the list of the processes that use the most network bandwidth. This chisel
 is compatible with containers using the sysdig -pc or -pcontainer argument, ot
herwise no container information will be shown.
Args:
(None)

That is, this chisel does not take any parameters. Let’s run it.

  $ sudo sysdig --chisel topprocs_net

For your case, the migration of a LXD container is performed by LXD, and it is not a process that runs from within a container. Therefore, in this case you do not need to use/write a chisel that understands containers.

The LXD process that performs the migration should look (when you run ps) like this:

11597 ? Ssl 0:00 /snap/lxd/current/bin/lxd forkmigrate ... ...

That is, the executable would be /snap/lxd/current/bin/lxd and it would have as first parameter the keyword forkmigrate. I have not verified this in practice, which means your first task is to start a migration and run ps to verify that there is such a process running. Once you identify the process, you can start working on measuring the traffic.

You would need to write a chisel that

  1. identifies when a process is started that has the name /snap/lxd/current/bin/lxd and first argument forkmigrate
  2. starts counting the network packets of this process and performs the logic of your benchmark

There are a few relevant chisels in /usr/share/sysdig/chisels that can help you. You can also check the documentation of sysdig in writing chisels.
Thanks sir, I am testing the same from yesterday and will update after completion.