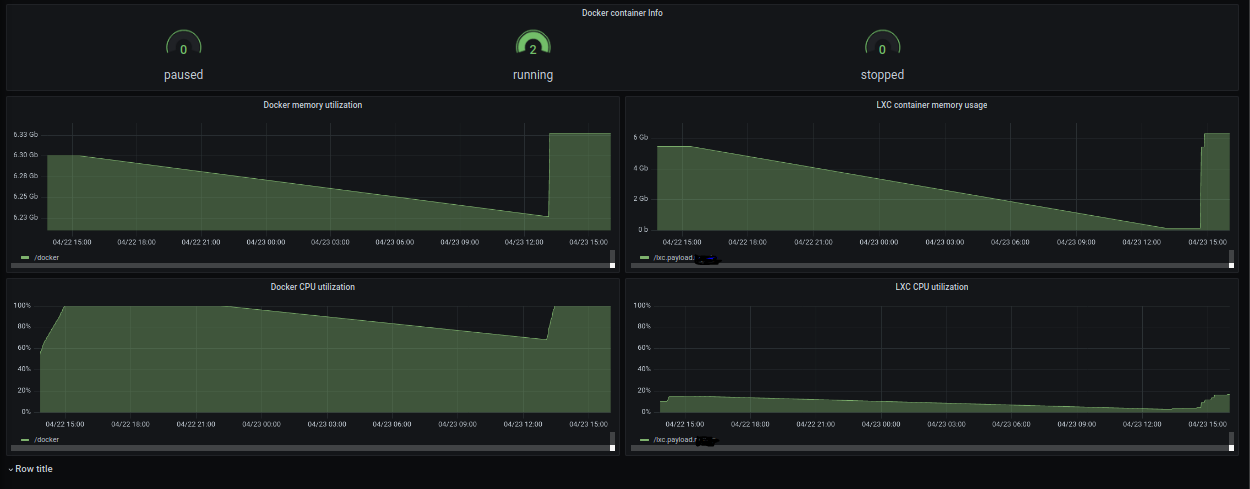
I have the LXC container running on my host Ubuntu-20.04. I wanted to monitor the docker health and thus on doing some research I took “cAdvisor+Prometheus+Grafana” and “node export+Prometheus+Grafana” as for monitoring. Here I am getting the info on the CPU, memory utilization, network related data as shown below
But, I need to monitor the processes running inside the containers. I need to check if the particular process is running or not. If it stopped/crashed then I should get to know about the crash. I need some tool for monitor the internal processes of the container. Is there any tool to take up this process monitoring task.? Can anybody suggest if such tools available or not? Or please suggest me how can I monitor the processes inside the containers? Any suggestion will help me a lot.
Currently you’d need to install telegraf/node-exporter inside each container, but we have plans to add a prometheus endpoint to LXD itself over the next 6 months or so which will help avoid that.
If we install telegratph/node export inside the container then how ill we get the monitoring result? Is it possible to get their data oh the host or do we need to login into container and take the telegraph and node export data? Can i get any info/example on this please.
Yes, ok. Thanks for the info sir. Sorry for the long post.
But why I am asking is currently I am running the node_exporter on my host to get the LXC related CPU and memory utilization info. Because Prometheus is not scrappimg the LXC CPU and memory utilization info without node_exporter running on my host. My scenario is like this:
I have my LXC container running on my Ubuntu-20.04 I tried to get the LXC info using Prometheus by defining the LXC job in the prometheus.yml file. But I couln’t get any data. Later on reading few articles I am used node_exporter. i.e. I am mannually running the node exporter binary on my host “./node_expoerter” and then in mapped the LXC target to the node of LXC to 9100 where node_exported is collecting the data. Then I am getting the LXC info.
Now, coming to the process monitoring if I run the node_exported inside the container then there comes multiple instances of node_exporter for prometheus to scrap the log ie.
One which is running outside the container which is running on my hist to scrap the LXC CPU and memory data.
Second which is running inside the container to scrap the process related data. Is this correct what I am doing?
May I know if I am on right path for collecting the CPU and memory utilization data of the LXC container? If not please suggest me the right way to collect the CPU and memory data of LXC container on Prometheus. kind request .
Because in case of docker we are defining the port in daemon.json and same port as is defined as target in the Prometheus.yml and getting the data related to memory and CPU utilization So kindly request you to suggest me on this.