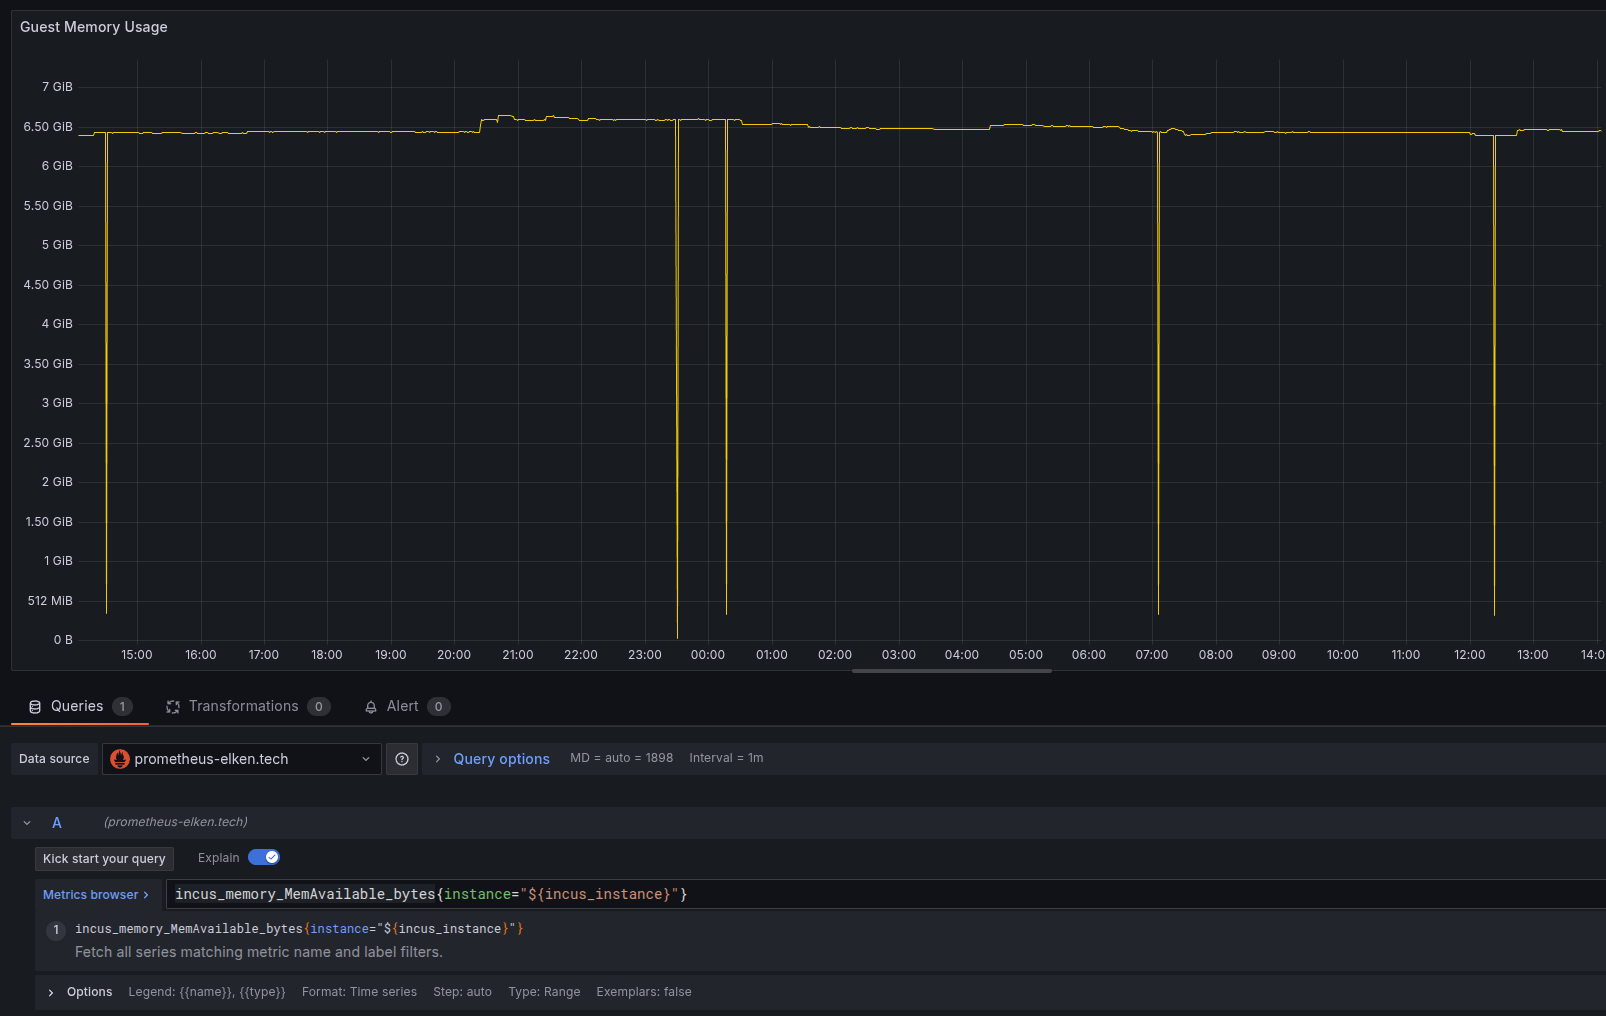
I’m using Grafana Alloy, to export node metrics. These spikes are very troublesome because they trigger my alarms. Does anyony have an idea what’s going on here?
My incus version is 6.0.4 on Ubuntu 24.04.2 .
This instance is a container.
In the graph I can see some very short dips. Most likely this are related to the tool since the metric is memory. It’s not likely that a 6.5GB memory usage would drop to around 200MB momentarily so that it rises up to 6.5GB on the next moment.
The interval is 1 minute. A lot of things can happen within at 1 minute.
Either the tool, when it runs in the container, misreports the memory use, or the container restarts or the process is swapped out (is that possible?).