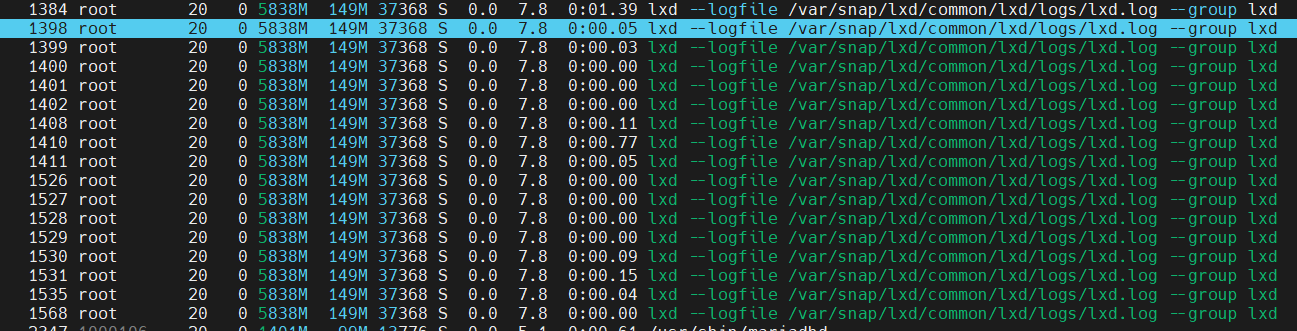
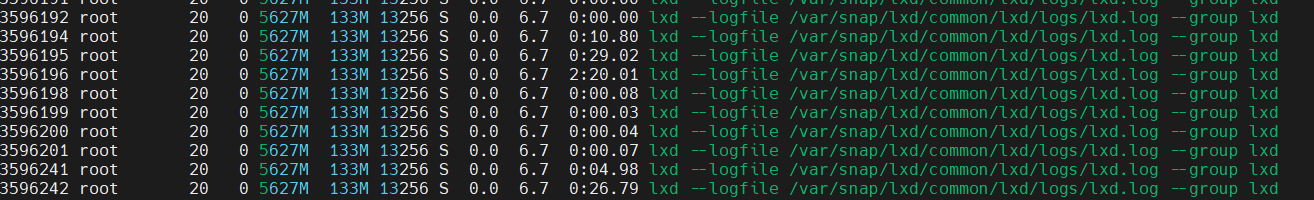
On my old server, LXD logs used to consume much less RAM than on my new server. I’ve gone from 45MB to 149MB… Why does the LXD log consume so much memory? For information, I am using a 2GB Hetzner VPS.
I run approximately the same number of containers, around 4, on both VPS.
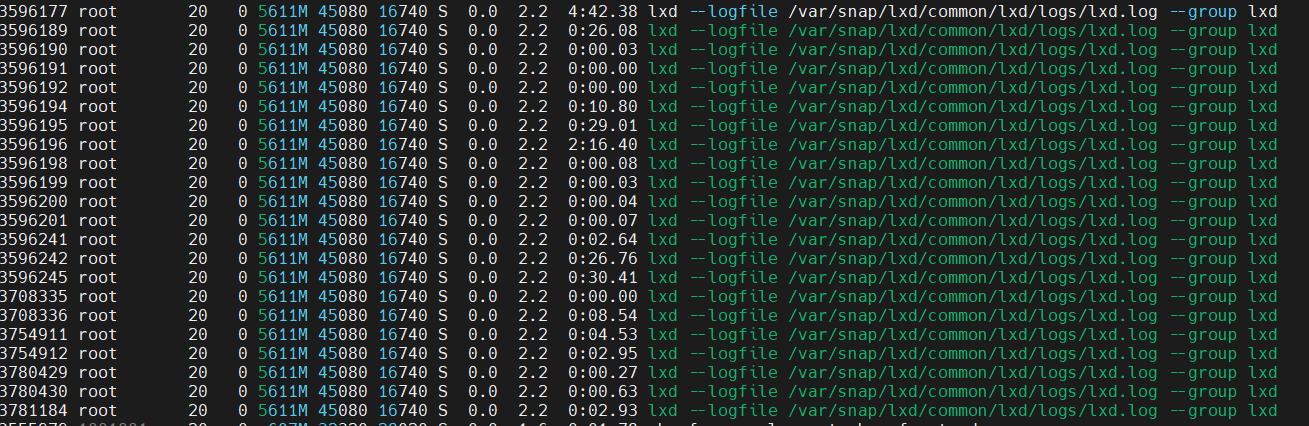
The LXD log process consumes a lot of memory for my 2GB RAM VPS.
LXD includes a built-in debugger which can help track those kind of things:
stgraber@castiana:~$ lxc config set core.debug_address 127.0.0.1:8444
stgraber@castiana:~$ go tool pprof http://127.0.0.1:8444/debug/pprof/heap
Fetching profile over HTTP from http://127.0.0.1:8444/debug/pprof/heap
Saved profile in /home/stgraber/pprof/pprof.lxd.alloc_objects.alloc_space.inuse_objects.inuse_space.002.pb.gz
File: lxd
Build ID: d391957b3e3a31801041848e6204f57c5ebda86a
Type: inuse_space
Time: Apr 8, 2023 at 7:59pm (EDT)
Entering interactive mode (type "help" for commands, "o" for options)
(pprof) top10
Showing nodes accounting for 6916.67kB, 81.83% of 8452.94kB total
Showing top 10 nodes out of 85
      flat  flat%   sum%        cum   cum%
 1539.31kB 18.21% 18.21%  1539.31kB 18.21%  regexp.onePassCopy
 1210.06kB 14.32% 32.53%  1210.06kB 14.32%  github.com/google/gopacket/layers.init
  536.37kB  6.35% 38.87%   536.37kB  6.35%  github.com/osrg/gobgp/v3/api.init
  532.26kB  6.30% 45.17%   532.26kB  6.30%  google.golang.org/protobuf/reflect/protoregistry.(*Files).RegisterFile.func2
  528.17kB  6.25% 51.42%   528.17kB  6.25%  regexp.(*bitState).reset
  521.05kB  6.16% 57.58%   521.05kB  6.16%  bytes.makeSlice
  512.50kB  6.06% 63.64%   512.50kB  6.06%  runtime.allocm
  512.38kB  6.06% 69.70%   512.38kB  6.06%  main.(*cmdForkexec).Command
  512.34kB  6.06% 75.77%   512.34kB  6.06%  golang.org/x/net/http2.init
  512.22kB  6.06% 81.83%   512.22kB  6.06%  google.golang.org/protobuf/internal/filedesc.newRawFile
(pprof) stgraber@castiana:~$ go tool pprof http://127.0.0.1:8444/debug/pprof/allocs
Fetching profile over HTTP from http://127.0.0.1:8444/debug/pprof/allocs
Saved profile in /home/stgraber/pprof/pprof.lxd.alloc_objects.alloc_space.inuse_objects.inuse_space.003.pb.gz
File: lxd
Build ID: d391957b3e3a31801041848e6204f57c5ebda86a
Type: alloc_space
Time: Apr 8, 2023 at 7:59pm (EDT)
Entering interactive mode (type "help" for commands, "o" for options)
(pprof) top10
Showing nodes accounting for 208.08MB, 53.78% of 386.89MB total
Dropped 327 nodes (cum <= 1.93MB)
Showing top 10 nodes out of 218
      flat  flat%   sum%        cum   cum%
   38.02MB  9.83%  9.83%    38.02MB  9.83%  github.com/lxc/lxd/lxd/db/cluster.getConfigRaw.func1
   35.53MB  9.18% 19.01%    39.03MB 10.09%  github.com/lxc/lxd/shared/simplestreams.(*Products).ToLXD.func1
   30.40MB  7.86% 26.87%    31.42MB  8.12%  io.ReadAll
   25.51MB  6.59% 33.46%    25.51MB  6.59%  github.com/lxc/lxd/lxd/db.(*ClusterTx).instanceConfigFill.func1
   16.50MB  4.27% 37.73%    81.53MB 21.07%  github.com/lxc/lxd/lxd/db/cluster.GetConfig
   13.52MB  3.49% 41.22%    13.52MB  3.49%  math/big.nat.make
   13.50MB  3.49% 44.71%    13.50MB  3.49%  github.com/canonical/go-dqlite/internal/protocol.(*Message).getString
      13MB  3.36% 48.07%    26.50MB  6.85%  github.com/canonical/go-dqlite/internal/protocol.(*Rows).Next
   12.01MB  3.10% 51.17%    12.01MB  3.10%  github.com/lxc/lxd/lxd/db.ExpandInstanceConfig
   10.09MB  2.61% 53.78%    13.26MB  3.43%  github.com/lxc/lxd/shared/simplestreams.(*SimpleStreams).applyAliases
(pprof) stgraber@castiana:~$
One thing worth keeping in mind, Go doesn’t use the more aggressive memory freeing behavior of the kernel, instead preferring to just let the kernel know that the memory is no longer used and that the kernel can reclaim at its convenience. This saves kernel time but at the cost of RSS being wrong as RSS will only shrink when the kernel does perform the recovery, which will typically only be when the system is under memory pressure.
You can change this behavior by making sure LXD runs with this in its environment GODEBUG=madvdontneed=1. This will result in an accurate RSS but at the cost of elevated CPU usage on memory release.
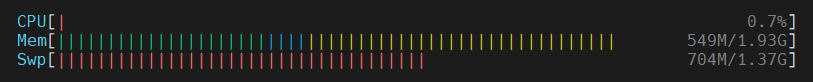
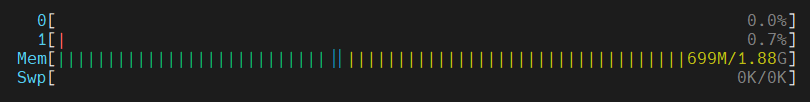
I think I may have found a lead ? On my old VPS, I was with Vultr which included Swap, but on the new one, I am with Hetzner and there is no Swap installed. I should note that both of my operating systems are Ubuntu 22.04.1 LTS.