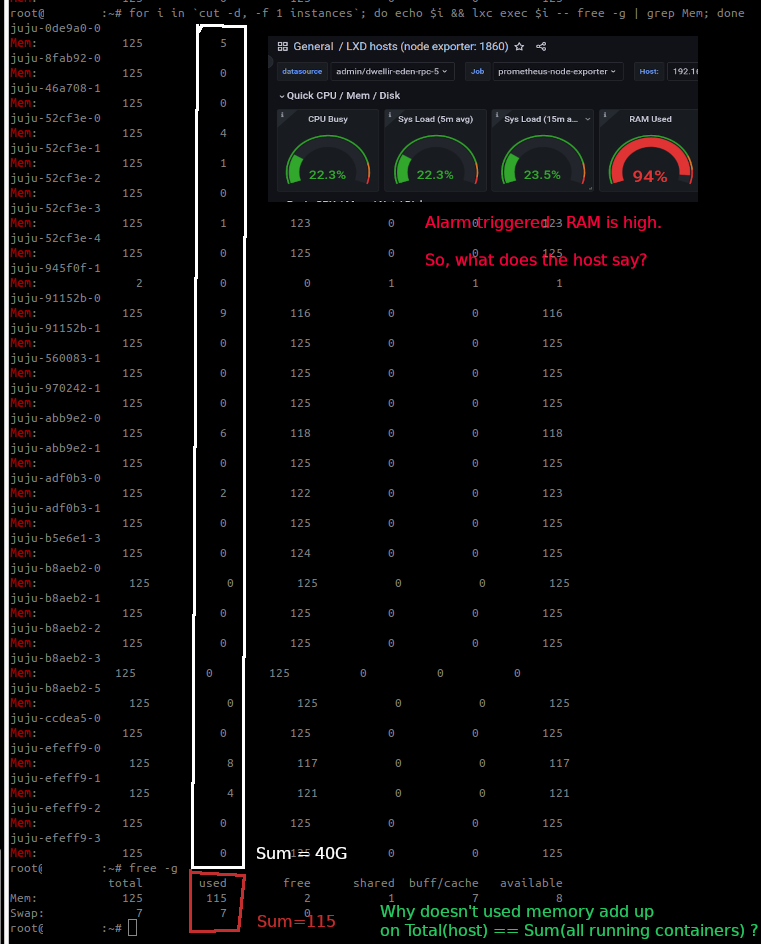
I have a LXD host with 128G RAM monitored by prometheus + grafana.
Grafana threw an alarm that memory usage if high (94%).
When I query all running containers on the host, they report a total of 40G used.
When I query the host however, it reports 115G used.
While I understand this would be a tricky situation to sort out, what metric or tool should I use as a way to monitor my host for potential memory capacity problems?
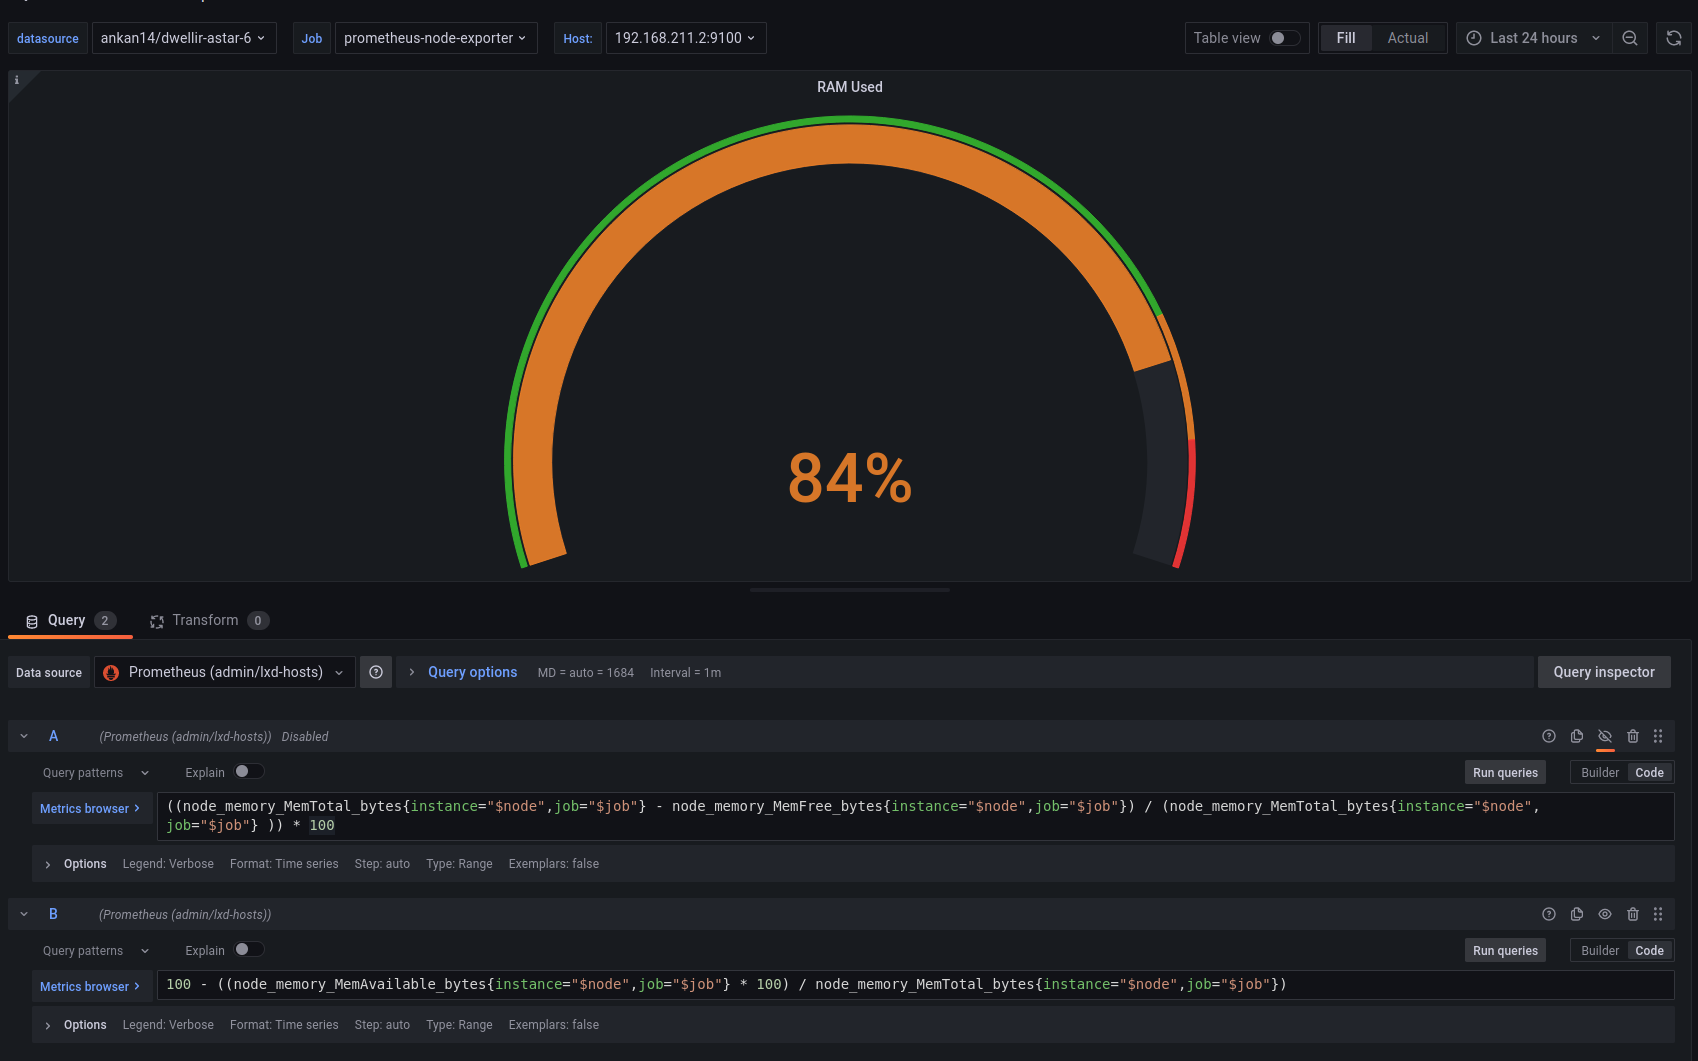
Grafana - reports 94%
Host reports 115G = 90%
Sum of all containers reports 40/128 = 31%
Here is a picture that describes the situation a bit better.
From what I can work out the live kernel settings change only take effect if the zfs_arc_max is lower than zfs_arc_min. So you may need to update the kernel boot parameters to to lower zfs_arc_min first.
Right, so we would need to test this first then I guess.
I’m thinking about setting the limits to about 2GB as seems to be what others have done. It feels a bit arbitrary at the moment, since we don’t really know.
Whats your gut feeling here given that our hosts are supposed to be dedicated LXD hosts?
Apart from the monitoring alert, was there any actual problem?
Or is it just a reporting issue, as ideally you do want to use as much unused memory for disk caching.
This is normally what happens with other filesystems.
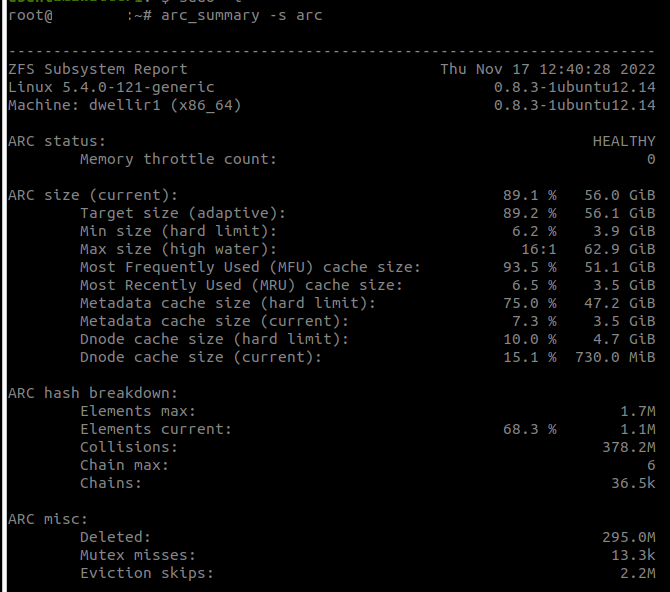
In theory, the ARC’s size is dynamically shrunk if there is memory pressure. If there is no memory pressure, having a big ARC translate to faster IOs. That back-off behavior should be easy to test by creating some big instance and watching the ARC shrink.
Contrary to popular belief, some swapping is good as it lets you better use your RAM. It only becomes a problem when there is lot of swap in/out activity. Here’s an interesting article about swap:
Totally, we thought this was the case but we haven’t tested it.
The problem is that “how do we monitor” our hosts to capture a pending “oom” situation when the hosts are constantly at “95%” RAM. I mean, how can we tell if the server is going to dive due to RAM shortage as opposed to “just normal ZFS caching”.
We also need to understand where new workload is possible or should be ran on a different host. When all hosts are at 95% RAM usage - how can we determine where new load should be placed?
I was wondering if that included the buffer field from free command (as that is the equivalent of the cache for non-ZFS filesystems). If it excluded that from the metric, then you could potentially also exclude the ARC cache from that metric too.
FYI
I have done some testing on how well the dynamic functionality works, to decide if we should decrease the max limit or not.
To fill the ARC cache I used fio in a few containers. Example command: fio --direct=0 --name=myfile --rw=read --ioengine=sync --bs=4k --numjobs=1 --size=16G --runtime=2400
And when the ARC cache is filled I tried to claim more memory than what was available, in another container. cat <( </dev/zero head -c 15000m) <(sleep 120) | tail
In the first tests I was kicked out from the containers with errors like Error: websocket: close 1006 (abnormal closure): unexpected EOF Error: write unix @->/var/snap/lxd/common/lxd/unix.socket: i/o timeout
But then I started the different processes inside screens instead. And the processes were actually running just fine.
So my conclusion is that the dynamic thingy seems to work well.
But as @erik_lonroth said, we need to find a good way to monitor this.
So, as @Joakim_Nyman said - we today started monitoring based on a combination of ARC cache used and available RAM.
The question remains as how we should deal with placement of new containers based on “load” parameters. As I believe the LXD team is exploring how to perform some kind of automatic “load-balancing”, I would be interested in knowing how you think about this situation.
“On what performance metrics do we decide on container placement?”