We have a few bundles and the prometheus2+grafana might interest you. Not sure if I already pointed you to it 
1 Like
WOW! I will dig into this immediately! I’ll come back and update here on the outcome! ![]()
![]()
![]()
1 Like

I find GitHub search to be lacking, anyway, here’s the bundle in question:
1 Like
I apprechiate this, but since the TLS information is not provided in the configuration of this bundle. The bundle will likely not work.
There needs to be certs included etc. and none of that information seems to be present in the bundles.
The LXD charm takes care of exchanging the certs and accompanying configs with prometheus2 through their relation channel.
Also, for those not using the LXD charm, please note that if you don’t care about TLS auth on the metrics endpoint, you can turn that feature off with core.metrics_authentication=false.
OMG, this would make my life alot easier! I’ll try this out for sure.
Also, I would love to try out the LXD charm soon enough. The already deployed machines isn’t suited for this adventure yet.
1 Like
https://www.youtube.com/watch?v=ix5XMDDkHLA
This one shows the full deployment of the current bundle including the grafana integration.
2 Likes
I’ve watched this many times actually @stgraber but I already had a full deployment going which I’m trying to “re-factor” partially using juju. It works rather OK, but I’m still to figure out how to get prometheus2 charm to be configured to the new situation.
What I just did in my lab was to run “lxc config set core.metrics_authentication=false”
But I don’t seem to be able to query it:
root@iceberg:~# curl -L http://localhost:8443/1.0/metrics
Client sent an HTTP request to an HTTPS server.
Do I need to mess also with “core.metrics_address” to get unauthenticated access somehow as opposed to the tls thing I’ve got going?
I tried this to no avail yet:
root@iceberg:~# lxc config set core.metrics_address ":9092"
So the server seems to expose something on 9092 now.
root@iceberg:~# ss -lnt
State     Recv-Q    Send-Q                          Local Address:Port         Peer Address:Port    Process
LISTEN    0         4096                                        *:9092                    *:*
...
Lets try it out with http
root@iceberg:~# curl -L http://127.0.0.1:9092/1.0/metrics
Client sent an HTTP request to an HTTPS server.
Nope
This is my current situation:
root@iceberg:~# lxc config show
config:
  core.https_address: :8443
  core.metrics_address: :9092
  core.metrics_authentication: "false"
  core.proxy_ignore_hosts: 127.0.0.1,192.168.2.224,::1,localhost
  core.trust_password: true
root@iceberg:~#
[UPDATE]
So, I managed to get metrics by accepting the “insecure” cert like this. (-k for curl)
root@iceberg:~# curl -k -L https://127.0.0.1:9092/1.0/metrics
...
lxd_procs_total{name="juju-fe5353-0",project="default",type="container"} 245
lxd_procs_total{name="juju-443094-0",project="default",type="container"} 103
...
Is this really the way to go here? Seems like enforcing still TLS as opposed to providing metrics over http only?
The core.metrics_authentication=false removes the need to provide a TLS client cert. You still need to use HTTPS and you will keep seeing the same server cert as normally. So yes, what you are doing is OK, except you can probably feed curl a copy of the server cert for TLS server verification.
1 Like
I got it to with with this wizardry:
lxc config set core.metrics_authentication=false
lxc config set core.metrics_address ":9092"`
In /var/snap/prometheus/current/prometheus.yml
  - job_name: 'lxd-host'
    metrics_path: '/1.0/metrics'
    scheme: https
    static_configs:
      - targets:
          - 192.168.2.2:9092
    tls_config:
      insecure_skip_verify: true
Restart prometheus
systemctl restart snap.prometheus.prometheus.service
Query for metrics:
curl -k -L https://192.168.2.2:9092/1.0/metrics
Works.
So, with juju I could now create a yaml file according to the docs:
erik@frozen:~$ cat prometheus2-scrape-job.yml
- job_name: 'lxd-host'
  metrics_path: '/1.0/metrics'
  scheme: https
  static_configs:
    - targets:
        - 192.168.2.2:9092
  tls_config:
    insecure_skip_verify: true
Then run juju config:
$ juju config prometheus2 scrape-jobs="$(cat prometheus2-scrape-job.yml)"
Which makes prometheus2 all happy and at least now its added as manual scrape jobs and isn’t lost when I reconfigure prometheus2 with juju etc.
This above all goes away I think once I deploy my LXD hosts with the charm I guess @stgraber but for now, this works good enough for what I have.
Perhaps something to add to docs?
Oh, this would perhaps also be something to mess around with how to get this to prometheus.yml somehow…
It is possible to merge scraping of multiple lxd server nodes in a single prometheus job, as long as metrics certs are same, which gave me personally a better control and overview in prometheus&grafana.
So instead of:
  - job_name: "lxd-abydos"
    metrics_path: '/1.0/metrics'
    params:
      project: ['jdoe']
      target: ['abydos']
    scheme: 'https'
    static_configs:
      - targets: ['abydos.hosts.example.net:8444']
    tls_config:
      ca_file: 'tls/abydos.crt'
      cert_file: 'tls/metrics.crt'
      key_file: 'tls/metrics.key'
      server_name: 'abydos'

  - job_name: "lxd-langara"
    metrics_path: '/1.0/metrics'
    params:
      project: ['jdoe']
      target: ['langara']
    scheme: 'https'
    static_configs:
      - targets: ['langara.hosts.example.net:8444']
    tls_config:
      ca_file: 'tls/abydos.crt'
      cert_file: 'tls/metrics.crt'
      key_file: 'tls/metrics.key'
      server_name: 'abydos'

  - job_name: "lxd-orilla"
    metrics_path: '/1.0/metrics'
    params:
      project: ['jdoe']
      target: ['orilla']
    scheme: 'https'
    static_configs:
      - targets: ['orilla.hosts.example.net:8444']
    tls_config:
      ca_file: 'tls/abydos.crt'
      cert_file: 'tls/metrics.crt'
      key_file: 'tls/metrics.key'
      server_name: 'abydos'
you could do:
prometheus.yml
  - job_name: lxd
    scrape_interval: 10m
    metrics_path: '/1.0/metrics'
    scheme: 'https'
    static_configs:
      - targets: ['abydos.hosts.example.net:8444','langara.hosts.example.net:8444', ....]
Or even further by aliasing them, which makes sorting more distinct:
prometheus.yml
      - targets: ['abydos.hosts.example.net:8444']
        labels:
          srv: abydos
      - targets: ['langara.hosts.example.net:8444']
        labels:
          srv: langara
At Grafana dashboard you can create new variable and sort them by label_values(instance,server) for first example
or label_values(srv) for second example.
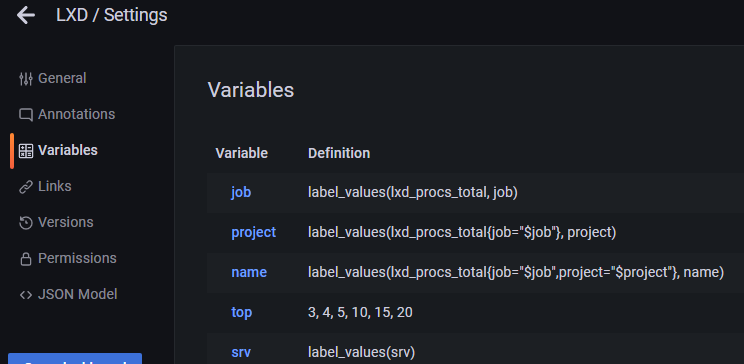
Which in dashboard produces a sort variable:

1 Like
Interesting! I’m not sure however how is the target URL parameter provided in the contracted forms?