Official Grafana dashboard for LXD

LXD 4.19 introduce support for a metrics interface which exposes an endpoint that’s compatible with the OpenMetrics format.

Combined with a tool like Prometheus, a standalone or clustered LXD deployment can be scrapped at a fixed interval and those metrics be stored in a time series database.

This enables all kind of interesting queries to find performance issues, potential misbehaving workloads, abuses or even gather usage metrics for billing purposes.

Details on how to setup the LXD side of it can be found here:

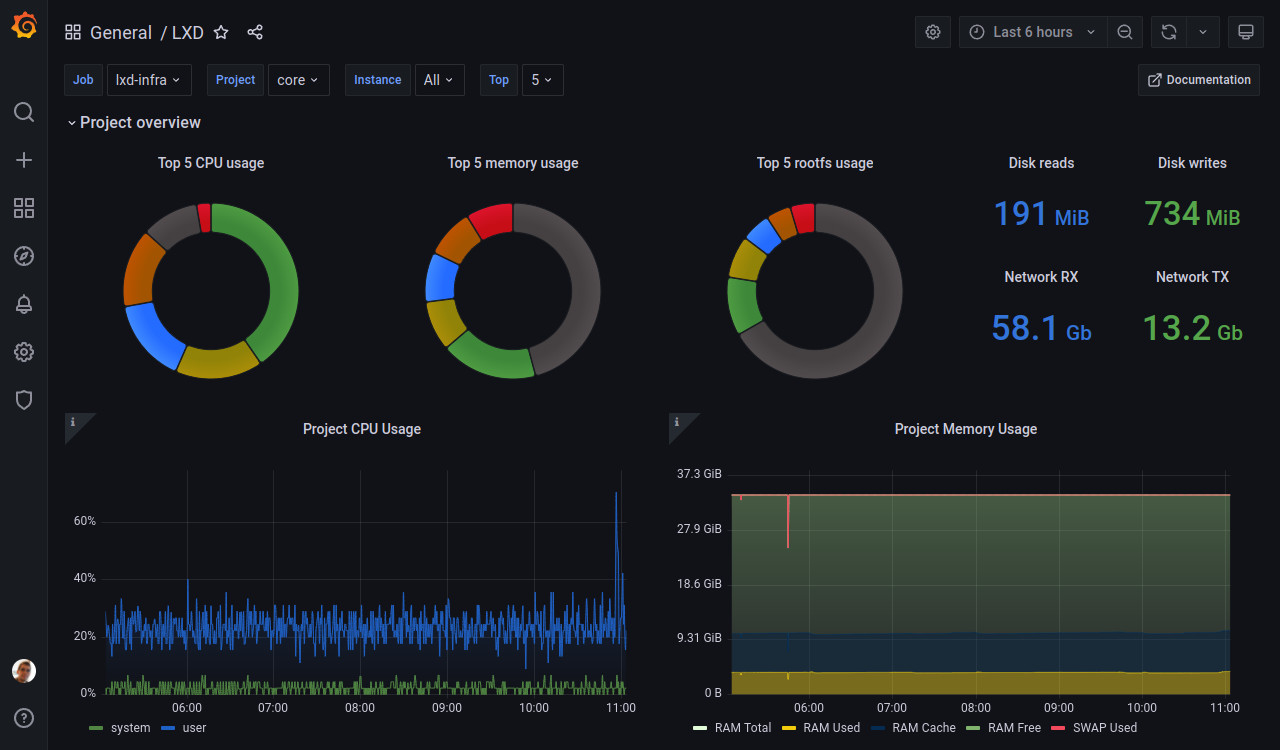
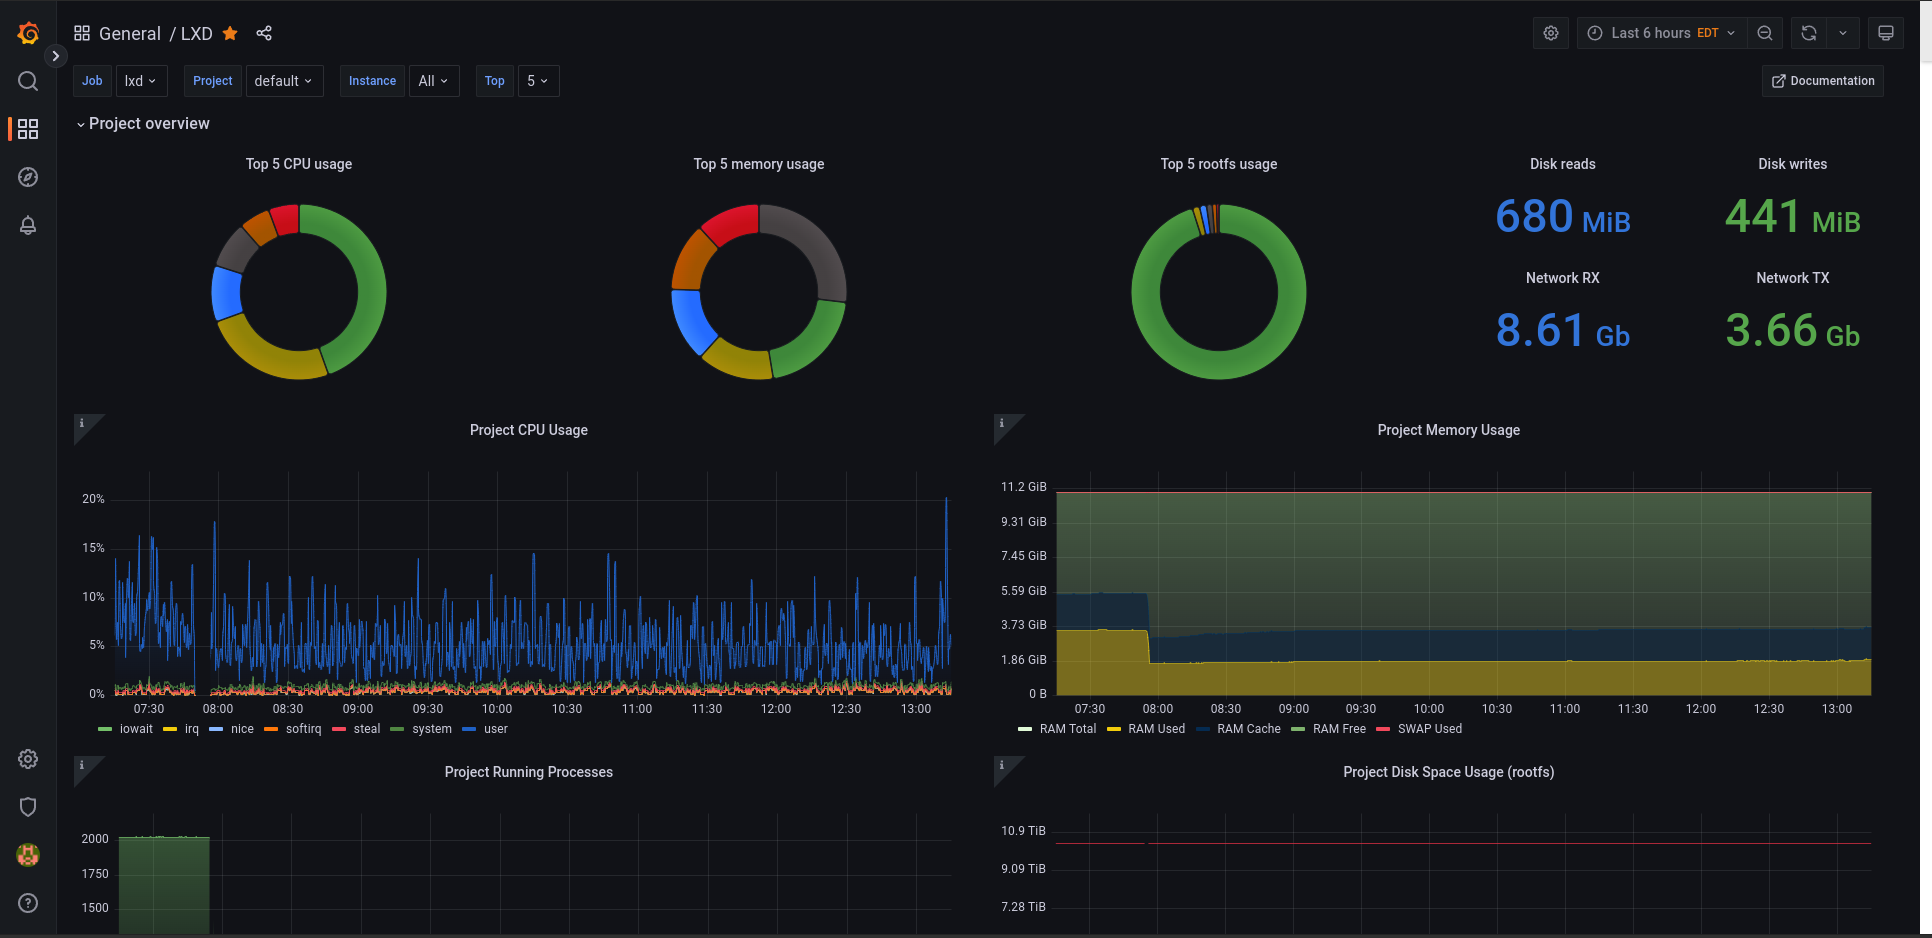
We’ve then been hard at work on a Grafana dashboard as a showcase of what can be done with those metrics and a good starting point for anyone looking at integrating our metrics with their dashboards.

Starting today, we have something that we feel is of pretty good quality and it can be found at:

It provides a per-project resource consumption overview:

As well as detailed per-instance data:

To set it up, you can import the dashboard id 15726 into your Grafana and pick your prometheus server configured per the instructions above as the data source.

Note that:

  • You need Grafana 8.4 or higher (required by our disk/network graphs)
  • You need prometheus 2.22 or higher (required for proper handling of some intervals)

Let us know how well that works for your setup and if there’s anything that we should consider adding. We’ve tried to focus on what a LXD cluster operator may need to identify problems in a multi-project environment.

8 Likes

Wow, nice job ! Will try it soon :wink:

When using the separate metric listener core.metrics_address, can we have an option that makes the metrics public so that the playing with certs is not necessary ?

That’d probably be fine to add though indeed restricted to the metrics-only listener.
Feel free to file a feature request at https://github.com/lxc/lxd/issues

https://youtu.be/EthK-8hm_fY

7 Likes

Excellent job with this!

Just set mine up with Prometheus & Grafana as docker containers inside a nested LXC container.

Looks as though these metrics are going to be quite useful.

Thanks for all the work you do around here. Very much appreciated!

3 Likes

Looks great now if only there was a LXD image or cloud-init template for setting up grafana/Prometheus services… :slight_smile:

I’m running 4.0.9 through the snap.
I’m running prometheus through snap:

sudo snap list
lxd         4.0.9-8e2046b  22753  4.0/stable/…   canonical✓  -
prometheus  2.28.1         53     2/stable       canonical✓  -

I’ve tried this: Instance metrics - LXD documentation

There are a number of issues:

  • lxc config trust add metrics.crt --type=metrics
    … Doesn’t work since --type isnt recognized.

  • ca_file: ‘tls/lxd.crt’
    … is a typo and should be ca_file: ‘tls/server.crt’

After fixing those issues, I’m till not having any luck and my prometheus shows this after a restart:

Also, can’t grab stats from curl:

 curl -k https://127.0.0.1:8443/1.0/metrics/
{"type":"error","status":"","status_code":0,"operation":"","error_code":404,"error":"not found","metadata":null}

Prometheus seems OK (also from logs)

systemctl is-active snap.prometheus.prometheus.service
active

What am I doing wrong?

4.0.9 doesn’t have the metrics API.

On focal, what’s the process of switching to lxd 5 through snapd? Can this be done with running containers?

snap refresh lxd --channel=5.0 will move you to the 5.0 LTS track from the 4.0 LTS track.
Instances will keep running during the update, only thing that goes offline is the LXD API itself, so not different from a normal minor bugfix update.

1 Like

Thanx @stgraber - I can confirm it worked now. I tried the dashboard (LXD dashboard for Grafana | Grafana Labs) and it also loads up.

The values are however a bit strange, but I’ll open a separate thread for that. Thanx!

THANK YOU. Your instructions worked for me (after I stopped messing it up… :-)).

Andrew

Any chance anyone has an example of a prometheus.yml file using multiple hosts in the scrape_config with tls?

The example here: Instance metrics - LXD documentation only show how a single target can be configured. I can’t figure out how it should look like for more than one…

1 Like

I have the same question, glad it’s not just me. :slight_smile:

@sdeziel do you know how this can be done?

Here’s my small scrape_configs which includes a few standalone LXD servers (c2d, ocelot, xeon, mars, jupiter) and a cluster (hdc) comprised of 3 nodes (abydos, langara and orilla). The hdc cluster as a whole was probably bootstrapped by abydos because they all have it’s cert. On that cluster, I only have access to a single project named sdeziel.

HTH

scrape_configs:
  # The job name is added as a label `job=<job_name>` to any timeseries scraped from this config.
  - job_name: "prometheus"
    static_configs:
      - targets: ["127.0.0.1:9090"]

  - job_name: "lxd-c2d"
    metrics_path: '/1.0/metrics'
    scheme: 'https'
    static_configs:
      - targets: ['c2d.mgmt.sdeziel.info:9101']
    tls_config:
      ca_file: '/var/snap/prometheus/common/certs/c2d.crt'
      cert_file: '/var/snap/prometheus/common/certs/metrics.crt'
      key_file: '/var/snap/prometheus/common/certs/metrics.key'
      # min_version is Prometheus 2.35.0+
      #min_version: TLS13
      server_name: 'c2d'

  # hdc servers: abydos, langara and orilla
  - job_name: "lxd-abydos"
    metrics_path: '/1.0/metrics'
    params:
      project: ['sdeziel']
      target: ['abydos']
    scheme: 'https'
    static_configs:
      - targets: ['abydos.hosts.dcmtl.stgraber.net:8444']
    tls_config:
      ca_file: '/var/snap/prometheus/common/certs/abydos.crt'
      cert_file: '/var/snap/prometheus/common/certs/metrics.crt'
      key_file: '/var/snap/prometheus/common/certs/metrics.key'
      server_name: 'abydos'

  - job_name: "lxd-langara"
    metrics_path: '/1.0/metrics'
    params:
      project: ['sdeziel']
      target: ['langara']
    scheme: 'https'
    static_configs:
      - targets: ['langara.hosts.dcmtl.stgraber.net:8444']
    tls_config:
      ca_file: '/var/snap/prometheus/common/certs/abydos.crt'
      cert_file: '/var/snap/prometheus/common/certs/metrics.crt'
      key_file: '/var/snap/prometheus/common/certs/metrics.key'
      server_name: 'abydos'

  - job_name: "lxd-orilla"
    metrics_path: '/1.0/metrics'
    params:
      project: ['sdeziel']
      target: ['orilla']
    scheme: 'https'
    static_configs:
      - targets: ['orilla.hosts.dcmtl.stgraber.net:8444']
    tls_config:
      ca_file: '/var/snap/prometheus/common/certs/abydos.crt'
      cert_file: '/var/snap/prometheus/common/certs/metrics.crt'
      key_file: '/var/snap/prometheus/common/certs/metrics.key'
      server_name: 'abydos'


  - job_name: "lxd-jupiter"
    metrics_path: '/1.0/metrics'
    scheme: 'https'
    static_configs:
      - targets: ['jupiter.tr.sdeziel.info:9101']
    tls_config:
      ca_file: '/var/snap/prometheus/common/certs/jupiter.crt'
      cert_file: '/var/snap/prometheus/common/certs/metrics.crt'
      key_file: '/var/snap/prometheus/common/certs/metrics.key'
      server_name: 'jupiter'

  - job_name: "lxd-mars"
    metrics_path: '/1.0/metrics'
    scheme: 'https'
    static_configs:
      - targets: ['mars.enclume.ca:9101']
    tls_config:
      ca_file: '/var/snap/prometheus/common/certs/mars.crt'
      cert_file: '/var/snap/prometheus/common/certs/metrics.crt'
      key_file: '/var/snap/prometheus/common/certs/metrics.key'
      server_name: 'mars'

  - job_name: "lxd-ocelot"
    metrics_path: '/1.0/metrics'
    scheme: 'https'
    static_configs:
      - targets: ['ocelot.mgmt.sdeziel.info:9101']
    tls_config:
      ca_file: '/var/snap/prometheus/common/certs/ocelot.crt'
      cert_file: '/var/snap/prometheus/common/certs/metrics.crt'
      key_file: '/var/snap/prometheus/common/certs/metrics.key'
      server_name: 'ocelot'

  - job_name: "lxd-xeon"
    metrics_path: '/1.0/metrics'
    scheme: 'https'
    static_configs:
      - targets: ['xeon.mgmt.sdeziel.info:9101']
    tls_config:
      ca_file: '/var/snap/prometheus/common/certs/xeon.crt'
      cert_file: '/var/snap/prometheus/common/certs/metrics.crt'
      key_file: '/var/snap/prometheus/common/certs/metrics.key'
      server_name: 'xeon'
2 Likes
1 Like

This is absolutely amazing!

I’m trying to piece together a config for the prometheus juju charm (Deploy Prometheus2 using Charmhub - The Open Operator Collection) as I’m deploying my monitoring with Juju.

If someone at Canonical already has something like that going such as that it automatically can be rendered, I’d be happy to know.

If not, I can add my experience here from that later on.