Querying storage pool metrics on IncusOS

Hi,

I’m using IncusOS and we are successfully collecting metrics and displaying them via Grafana. We basically followed this guide:

During the verification process of the metrics we noticed that the reported storage usage did not align with what’s reported by IncusOS on the web ui. As an example this is the storage pool usage shown on IncusOS:

grafik

And this is the Grafana Panel for the storage:
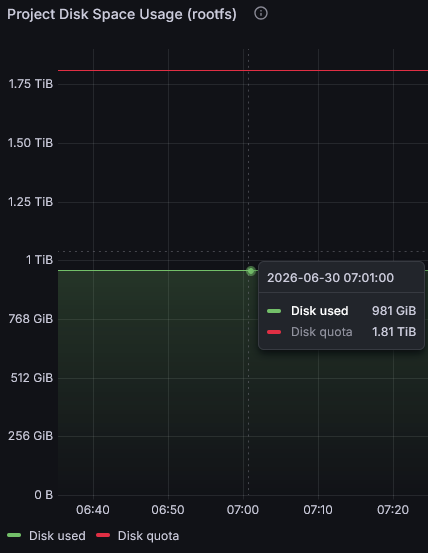
This are the (default) queries used for generating the graph:

# disk used
sum(incus_filesystem_size_bytes{job="$job",project="$project"} - incus_filesystem_avail_bytes)

# disk quota
sum(incus_filesystem_size_bytes{mountpoint="/",job="$job",project="$project"})

As far as I understand the incus_filesystem_* metrics are gathered from inside the VMs/Containers. So those values would be calculated based on what df -h would show inside the container/VM. Is this correct? So in this case disk quota is basically the space that’s been allocated for the VMs (the size of partitions inside the VM) and disk used the space used as reported by the VM.

Querying individual VMs seems to align with this assertion and the metrics seem to be accurate.

This is what is actually shown inside the VM:
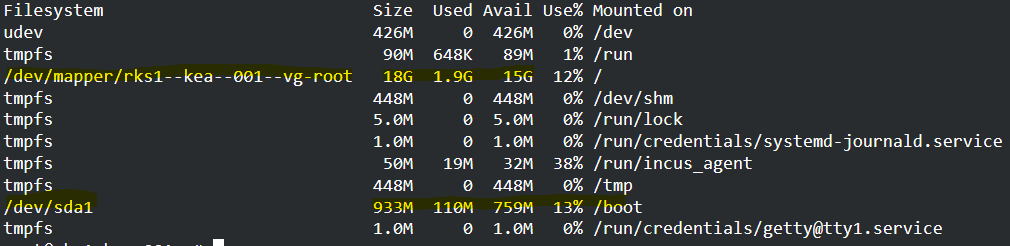
And the gathered metrics agree with the information inside the VM (the graph adds the sizes of / and /boot together):
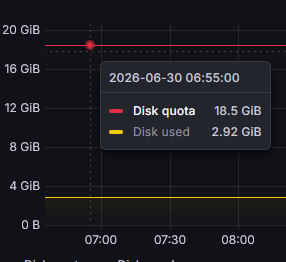
These are the queries I used for the individual VM:

# disk quota
sum(incus_filesystem_size_bytes{device!="config", fstype!="tmpfs", project="default", name="vm-redacted-01"})

# disk usage
sum(incus_filesystem_size_bytes{device!="config",fstype!="tmpfs", project="default", name="vm-redacted-01"} - incus_filesystem_avail_bytes{fstype!="tmpfs", project="default", name="vm-redacted-01"})

Is there way to also query for the usage / available space of the storage pool itself?

I tried different metrics and calculations using incus_filesystem_* and node_filesystem_*, but I could never get something that aligns with the total storage usage shown on the web ui (1.1 TiB) and the available 4.9 TiB storage.

Ref: export storage pool metrics for prometheus · Issue #2097 · lxc/incus · GitHub

The good news is, incusOS should already merge in node_exporter metrics - look for metrics like node_zfs_zpool_state. (I don’t have an incusOS host to test this)

The bad news is, node_exporter currently doesn’t give the overall zpool utilization figures. Feat: Report ZFS pool and volume size/alloc/free · Issue #3232 · prometheus/node_exporter · GitHub - I have tested this with the latest node_exporter 1.11.1

I don’t know how the incusOS UI gets its data, but I guess it’s via the incus API.

Hey

Thank you for the reply. Yeah I saw the node_zfs_* metrics, but none seems to be what I was looking for.

I actually already query some node_zfs_zpool_state metrics to check the health status of the zpool, but did not see anything useful about space usage.

I guess is good to get confirmation that the node_exporter doesn’t give the overall zpool utilization figures. I did not see #3232.

Thank you again!

I think it would be worth resurrecting export storage pool metrics for prometheus · Issue #2097 · lxc/incus · GitHub - @stgraber said he was not averse to adding metrics if there was a good use case and they are not too expensive.

In this case, it would just be a case of doing something equivalent to:

$ incus query /1.0/storage-pools/zfs/resources
{
	"inodes": {
		"total": 0,
		"used": 0
	},
	"space": {
		"total": 171332615168,
		"used": 33304677888
	}
}

(repeated for all storage pools).

Having said that, it doesn’t seem to compare very well with what zpool says:

$ zpool list -p
NAME          SIZE         ALLOC          FREE  CKPOINT  EXPANDSZ   FRAG    CAP  DEDUP    HEALTH  ALTROOT
zfs0  246960619520  101283193344  145677426176        -         -     32     41   1.00    ONLINE  -

It works fine for ext4 and LVM pools. Maybe I need to report this.

I won’t raise it as an issue, because it might be working-as-intended-but-not-well-documented. What I find is:

zfs storage pool

Does not agree with zpool list

$ incus storage show zfs
config:
  source: zfs0/lxd
  volatile.initial_source: zfs0/lxd
  zfs.pool_name: zfs0/lxd
description: ""
name: zfs
driver: zfs
...

$ incus query /1.0/storage-pools/zfs/resources
{
	"inodes": {
		"total": 0,
		"used": 0
	},
	"space": {
		"total": 171332615168,
		"used": 33304677888
	}
}

$ sudo zpool list -p
NAME          SIZE         ALLOC          FREE  CKPOINT  EXPANDSZ   FRAG    CAP  DEDUP    HEALTH  ALTROOT
zfs0  246960619520  101283193344  145677426176        -         -     32     41   1.00    ONLINE  -

The incus total is 70.4GiB lower than expected, and used is 63.3GiB lower than expected.

However, there are other (non-incus) datasets in this zpool, and if I add up their used sizes from zfs list it comes to 63.21GiB. I suspect that the zpool information is being adjusted somehow.

ext4 storage pool

Works exactly as expected.

$ incus query /1.0/storage-pools/default/resources
{
	"inodes": {
		"total": 19660800,
		"used": 1277135
	},
	"space": {
		"total": 315926315008,
		"used": 220184858624
	}
}

$ df -k /
Filesystem           1K-blocks      Used Available Use% Mounted on
/dev/mapper/vg0-root 308521792 215024276  77752492  74% /

$ df -i /
Filesystem             Inodes   IUsed    IFree IUse% Mounted on
/dev/mapper/vg0-root 19660800 1277135 18383665    7% /

lvm storage pool

This works as expected, at least for a thin pool:

$ incus storage show vg0
config:
  lvm.thinpool_name: IncusThinPool
  lvm.vg.force_reuse: "true"
  lvm.vg_name: vg0
  size: 300GiB
  source: vg0
  volatile.initial_source: vg0
...

$ incus query /1.0/storage-pools/vg0/resources
{
	"inodes": {
		"total": 0,
		"used": 0
	},
	"space": {
		"total": 322122547200,
		"used": 41779294371
	}
}

$ sudo lvdisplay vg0/IncusThinPool
  --- Logical volume ---
  LV Name                IncusThinPool
  VG Name                vg0
  LV UUID                y3DvBU-2R6l-tkP0-JEgo-FiCS-9NmY-4ju6Mp
  LV Write Access        read/write (activated read only)
  LV Creation host, time brian-kit, 2025-07-21 10:37:12 +0000
  LV Pool metadata       IncusThinPool_tmeta
  LV Pool data           IncusThinPool_tdata
  LV Status              available
  # open                 0
  LV Size                300.00 GiB
  Allocated pool data    12.97%
  Allocated metadata     15.29%
  Current LE             76800
  Segments               1
  Allocation             inherit
  Read ahead sectors     auto
  - currently set to     1024
  Block device           252:5

Incus gets its information using zfs get on the dataset backing the pool, not by pulling the full zpool metrics as the zpool may be shared with others.

And indeed for containers, the disk usage comes from the storage driver, so in the case of ZFS, a similar zfs get on the container’s dataset. For VMs, it depends. If you have the agent, then you get the metrics from within the VM. If the agent isn’t present or the VM isn’t trusted, then you get the usage from the storage driver on the host, but those lack a lot of the granularity and in some cases will just look like the whole disk is used.

Are the any plans to expose more zfs information through /1.0/metrics? Maybe with something like GitHub - pdf/zfs_exporter: Prometheus ZFS exporter · GitHub ? Otherwise, atleast on IncusOS, I haven’t found a good way to monitor useful/accurate zfs pool information (aside from zpool state and some other stuff that node_exporter currently supports).

Note: I’ve never used zfs_exporter or any other alternative zfs exporter.

@candlerb Thank you for your analysis :slight_smile: . It was insightful.

I think the simplest approach for incus would be to expose what is already exposed in the API under /1.0/storage-pools/<pool>/resources as metrics.

This doesn’t give the “true” zpool utilization figures, but at least it’s consistent with what you get elsewhere from incus, from the point of view of an incus storage pool.

Longer term, I’d hope that node_exporter would gain native zpool metrics.

The following PR would add the storage metrics that I was looking for :smiley: .

Good job.

Very minor point: I would argue that incus_storage_pool_size_bytes would be more consistent with Prometheus metric naming conventions than incus_storage_pool_total_bytes - since total is usually used as a suffix for counters.