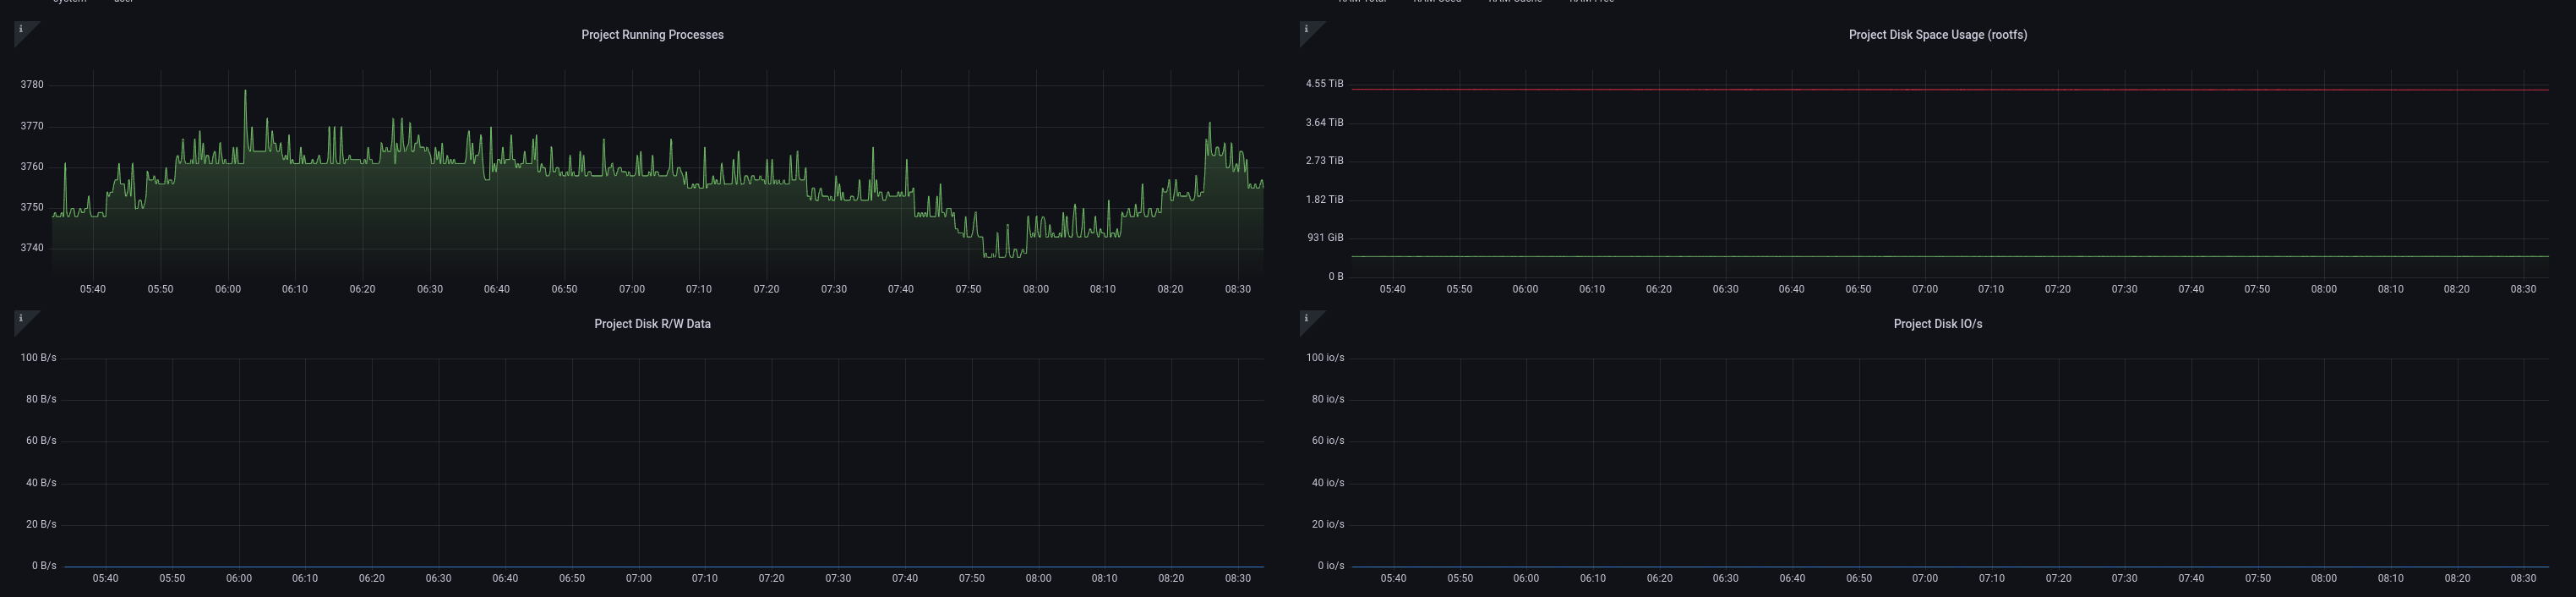
I/O reporting doesn’t work on ZFS unfortunately as ZFS doesn’t use the correct kernel codepath for that.
The source of the high total storage is likely that your containers don’t have a disk limit and so each report the total pool size as their disk size. The dashboard then aggregates that which adds it up and ends up being significantly larger than the actual underlying storage.
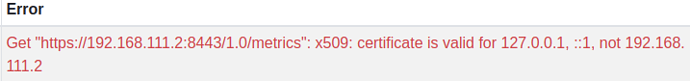
We run prometheus in a LXD container and want to scrape from the LXD host. We have created certificates according to Linux Containers - LXD - Has been moved to Canonical but get this error about the certificate:
Do you know what we should do differently to make this work?
prometheus tries to do proper CN/SAN validation against the name provided in the targets list. When that doesn’t march what’s in the cert, you can provide a server_name to prometheus. I have a similar setup where the LXD server cert looks like:
# openssl x509 -noout -text -in c2d.crt | grep c2d
        Issuer: O = linuxcontainers.org, CN = root@c2d
        Subject: O = linuxcontainers.org, CN = root@c2d
                DNS:c2d, IP Address:127.0.0.1, IP Address:0:0:0:0:0:0:0:1
If you followed the instruction on Instance metrics - LXD documentation, I’d think the cert would be good. Can you check if the cert shows up with the right type with:
$ lxc config trust ls | grep 900e79c7b44d
| metrics | metrics_dwellir1.crt | metrics.local | 900e79c7b44d | May 9, 2022 at 7:23pm (UTC) | May 6, 2032 at 7:23pm (UTC) |
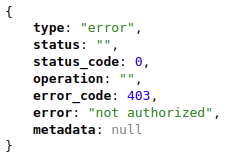
Since you are getting a not authorized error, maybe the private key you are using doesn’t match that public key? You can share the output of running this on the private key:
openssl ec -pubout -in metrics_dwellir1.key
The output is OK to share as it’s just the public portion.
The json you showed made me realize that you might be going to your prometheus webUI under /targets and clicking the link to 192.168.111.2:8443/1.0/metrics. Is that right?
If so, that can’t work because it tells your browser to make a direct connection to the target in question and your browser doesn’t have the cert/key.
You are totally right! I realize now that it actually started working after fixing the server cert. I can see all the metrics for the containers in prometheus and grafana now. Thanks a lot for the help and sorry for the unnecessary troubleshooting with the metrics cert!
@sdeziel this is huge and we’ll need to write up some kind of guide on this. Its massively useful. If we now only could get that zfs I/O metrics in there…