With the arrival of the LXD metrics endpoint feature in LXD 4.19, I thought it would be interesting to share a basic configuration to retrieve these metrics via the Telegraf agent. The metrics will be stored in an InfluxDB 2.x instance inside of an Ubuntu 21.10 container.
LXD configuration
Configure the LXD metrics endpoint to listen locally :
$ lxc config set core.metrics_address "127.0.0.1:9100"
InfluxDB configuration
Since I used Influx to test this new LXD feature, here is the basic steps to ensure you can send metrics into this timeseries database.
Once InfluxDB 2 is installed, connect to the web interface on port 8086 (you way want to use an LXD proxy to access it) and initialize the instance. From my side, my organization name is home.lab and my bucket name is metrics.
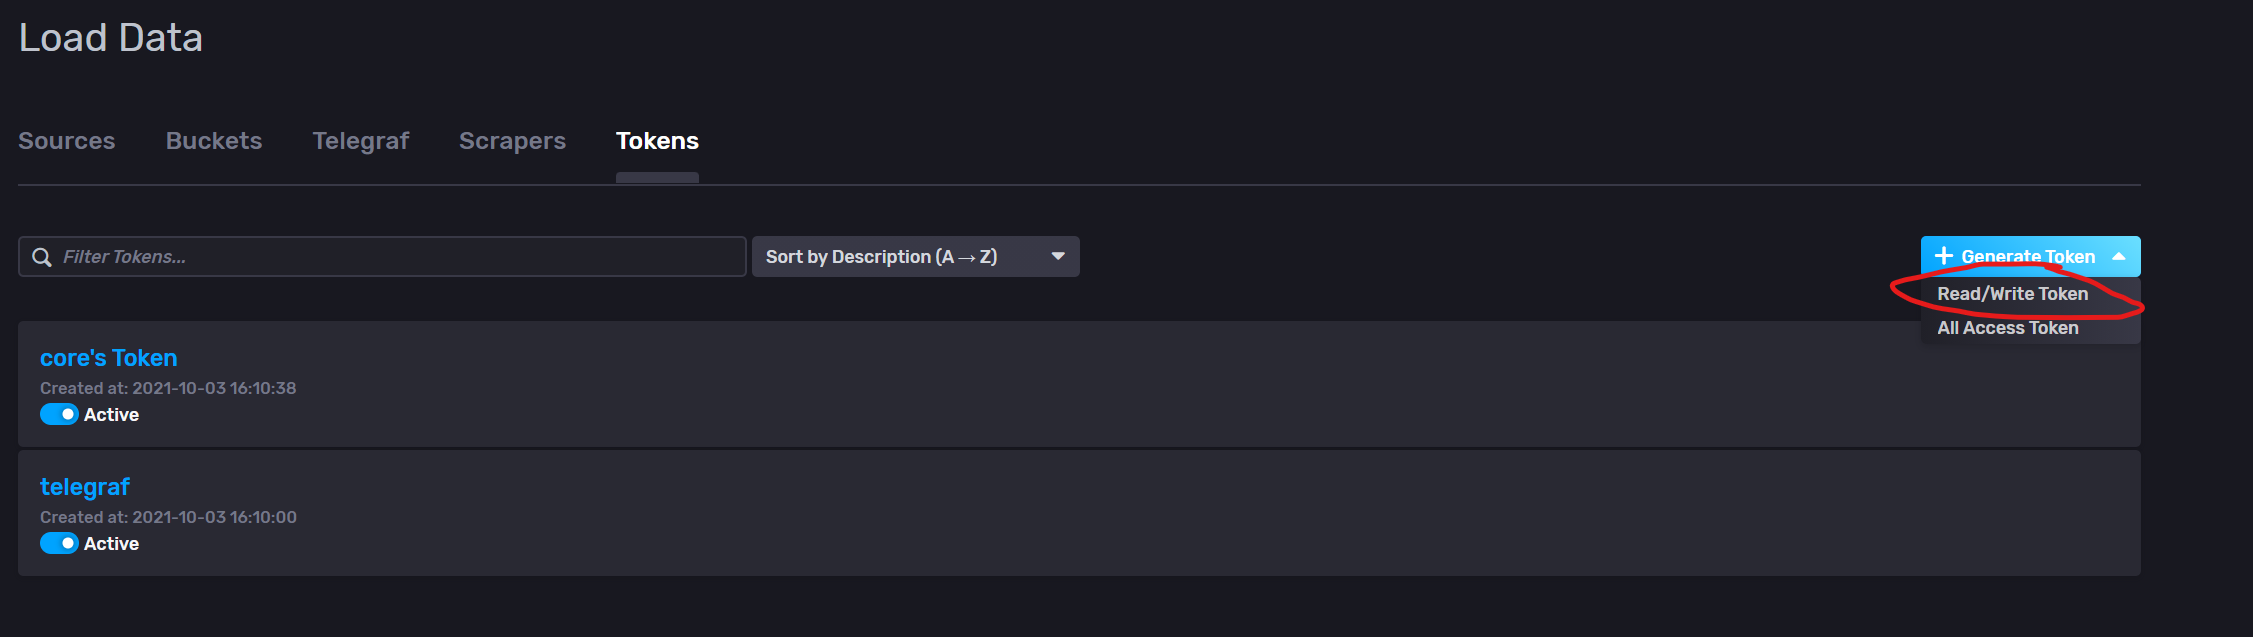
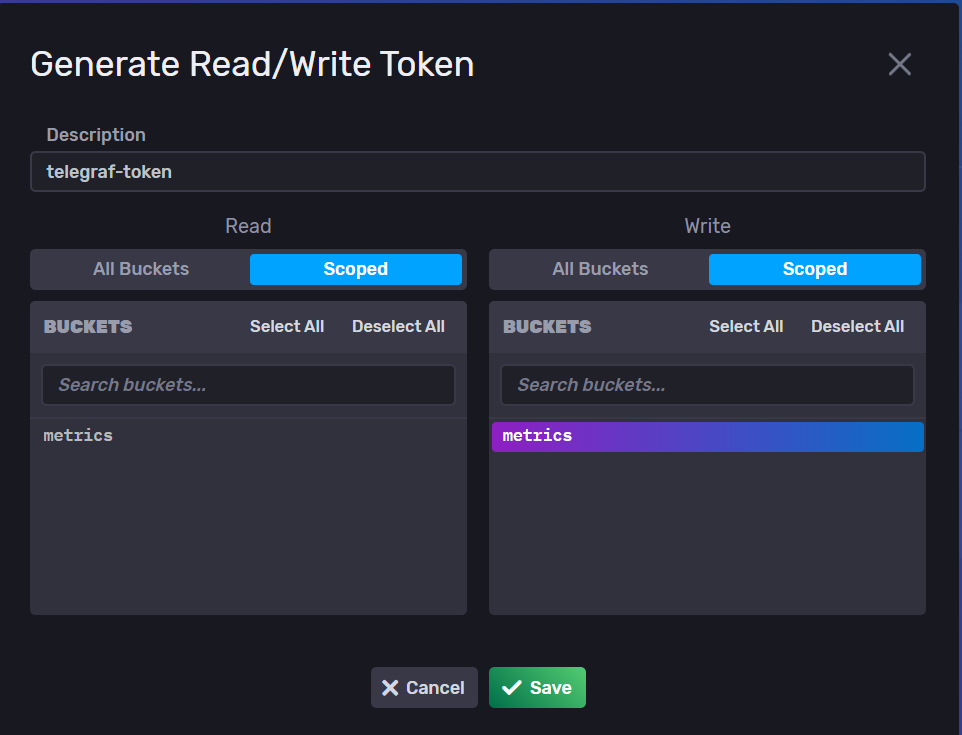
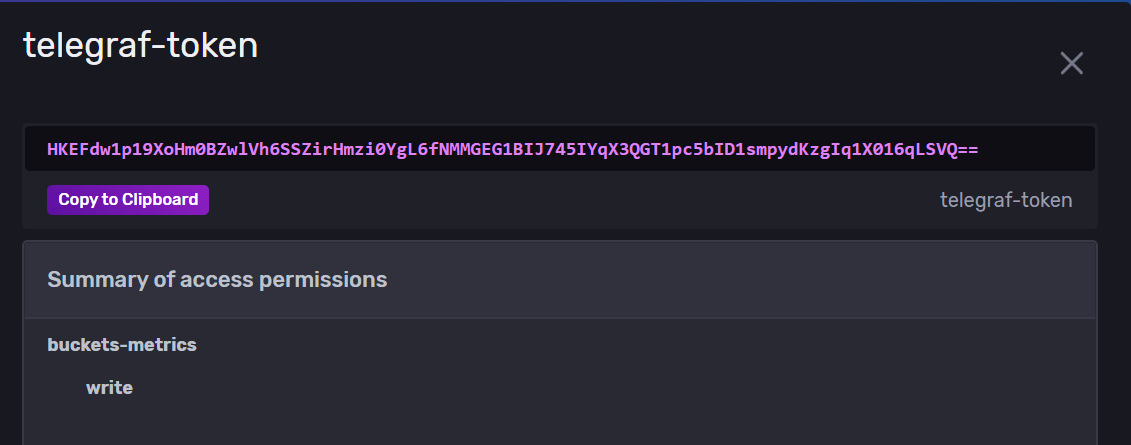
You need to generate a token to allow Telegraf to send metrics into your InfluxDB instance :
# /etc/telegraf/telegraf.d/output_influxdb.conf
[[outputs.influxdb_v2]]
  urls = ["http://<IP address of your InfluxDB instance>:8086"]
  token = "<token generated on the web interface>"
  organization = "home.lab"
  bucket = "metrics"
Restart Telegraf to apply configurations :
$ systemctl restart telegraf
Wait few minutes and metrics must be reported in the InfluxDB Data Explorer. Go to Explore in the InfluxDB interface to create a basic query :
On my side, I’ve configured my Prometheus server to start scraping my LXD servers in my production cluster. I still need to figure out a good Grafana dashboard to show the data though, then we can publish another tutorial for a setup using Prometheus and Grafana
@stgraber I’m actually looking into monitoring LXD with Prometheus atm, can you share what you already achieved on Prometheus side? I’m starting from 0, so any pointers / configs to look at would be nice.
Which then scrapes my servers every 30s (you need to scrape slower than 15s or you may get the same values twice from the cache).
On the grafana front, I’ve not done much yet. I have a dashboard which lists all projects and instances and shows the process and network usage. So still a long long way to go. I’d love for it to show an overview of resource usage for the selected projects at the top and then show the per-instance usage underneath.
If I might make one suggestion here and add in insecure_skip_verify = true as the ssl certs we just generated aren’t technically valid since they are self-signed. Took me a few minutes to figure out how to get telegraf to actually ask lxd for the metrics
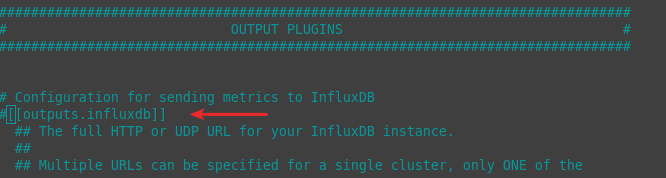
Also if you don’t want telegraf spamming your syslog with useless messages about not being to connect to local influxdb you can comment out the default [[outputs.influxdb]] in /etc/telegraf/telegraf.conf:
Ah yeah. It’s definitely possible to have LXD run a valid certificate but it’s pretty uncommon so I suspect most folks will have to rely on disabling the verification
I followed this guide and it worked great… for 30 days! By default, openssl is generating certs with a 30 day expiry. You can extend this when generating the certificate with -days, such as: