Single LXD container gets in a bad state, need a host restart to resolve

Hi,

With reference to my post in the thread If the shutdown and startup are timed correctly, a zombie listen port will be created:

My container has been running fairly stable for about two weeks but has started mis-behaving.

  • First noted since the load average is high; currently about 16 when normally about 2. No obvious culprits in top but this is the same MO as I have seen on last two occasions of this issue.
  • The culprit (or at least the most obviously impacted) container is running Plex Media Server
  • The Plex web frontend seems to be working for browsing the libraries etc but will not play media and has stopped pulling DVR guide data, etc.
  • Attempted a shutdown of the service within the container which failed. systemctl status plexmediaserver shows the service is now in a failed state.
  • Attempt to stop the container and lxc stop plex never returns. After five minutes, +c out.
  • lxc info below. Note the network interfaces have gone. Log messages are quite benign I think.
Name: plex
Location: none
Remote: unix://
Architecture: x86_64
Created: 2021/06/06 12:50 UTC
Status: Running
Type: container
Profiles: default
Pid: 22671
Resources:
  Processes: 6
  Disk usage:
    root: 16.76GB
  CPU usage:
    CPU usage (in seconds): 159936
  Memory usage:
    Memory (current): 230.21MB
    Memory (peak): 12.46GB
Snapshots:
  snap0 (taken at 2021/06/15 11:41 UTC) (stateless)

Log:

lxc plex 20210731102443.919 WARN     conf - conf.c:lxc_map_ids:3389 - newuidmap binary is missing
lxc plex 20210731102443.920 WARN     conf - conf.c:lxc_map_ids:3395 - newgidmap binary is missing
lxc plex 20210731103736.799 WARN     conf - conf.c:lxc_map_ids:3389 - newuidmap binary is missing
lxc plex 20210731103736.799 WARN     conf - conf.c:lxc_map_ids:3395 - newgidmap binary is missing
  • Attempt to stop the container with ‘-f’ flag, still seems to run forever. No change to output of lxc info.
  • The host is running Ubuntu 20.04.2.
  • Running LXD snap. tracking: 4.0/stable/ubuntu-20.04 and installed: 4.0.7

Happy to leave this container in a dodgy state for next day or so but will need to recover it for next week. Only way I have to recover is to restart the host.

Regards,
Whytey

You probably want to run dmesg to see if there’s some kind of kernel error.

@stgraber

Excellent - seems to point to something. The following is dmesg output from the host (I can no longer get into the container). Load started to increase at this point according to my monitoring and this Kernel error seems to relate to the Plex process in some way!

[Tue Jul 27 16:05:58 2021] #PF: supervisor write access in kernel mode
[Tue Jul 27 16:05:58 2021] #PF: error_code(0x0002) - not-present page
[Tue Jul 27 16:05:58 2021] PGD 0 P4D 0 
[Tue Jul 27 16:05:58 2021] Oops: 0002 [#1] SMP PTI
[Tue Jul 27 16:05:58 2021] CPU: 6 PID: 1745145 Comm: Plex Media Serv Tainted: P           O      5.4.0-77-generic #86-Ubuntu
[Tue Jul 27 16:05:58 2021] Hardware name: Dell Inc. PowerEdge T320/0FDT3J, BIOS 2.4.2 01/29/2015
[Tue Jul 27 16:05:58 2021] RIP: 0010:avl_rotation.isra.0+0x211/0x240 [zavl]
[Tue Jul 27 16:05:58 2021] Code: 83 c8 01 49 89 43 10 48 85 db 75 27 48 8b 45 d0 4c 89 18 48 83 c4 10 b8 01 00 00 00 5b 41 5c 41 5d 41 5e 41 5f 5d c3 48 63 ff <4c> 89 14 fb e9 e5 fe ff ff 48 63 ff b8 01 00 00 00 4c 89 1c fb 48
[Tue Jul 27 16:05:58 2021] RSP: 0018:ffffb22ac842fb70 EFLAGS: 00010202
[Tue Jul 27 16:05:58 2021] RAX: 000000000000000a RBX: 0000000000000008 RCX: 0000000000000000
[Tue Jul 27 16:05:58 2021] RDX: 0000000000000001 RSI: ffff8c9865c79630 RDI: 0000000000000000
[Tue Jul 27 16:05:58 2021] RBP: ffffb22ac842fba8 R08: 0000000000000000 R09: 0000000000000008
[Tue Jul 27 16:05:58 2021] R10: ffff8c97dc004208 R11: 0000000000000000 R12: ffff8c97dc004210
[Tue Jul 27 16:05:58 2021] R13: 0000000000000000 R14: 00000000ffffffff R15: ffff8c9865c79630
[Tue Jul 27 16:05:58 2021] FS:  00007fc9550beb38(0000) GS:ffff8c9c0f180000(0000) knlGS:0000000000000000
[Tue Jul 27 16:05:58 2021] CS:  0010 DS: 0000 ES: 0000 CR0: 0000000080050033
[Tue Jul 27 16:05:58 2021] CR2: 0000000000000008 CR3: 000000053d9f4001 CR4: 00000000001606e0
[Tue Jul 27 16:05:58 2021] Call Trace:
[Tue Jul 27 16:05:58 2021]  avl_insert+0xa9/0xb0 [zavl]
[Tue Jul 27 16:05:58 2021]  zfs_rangelock_add_reader+0x14c/0x1e0 [zfs]
[Tue Jul 27 16:05:58 2021]  zfs_rangelock_enter_reader+0xf1/0x1c0 [zfs]
[Tue Jul 27 16:05:58 2021]  zfs_rangelock_enter+0xed/0xf0 [zfs]
[Tue Jul 27 16:05:58 2021]  zfs_get_data+0x158/0x350 [zfs]
[Tue Jul 27 16:05:58 2021]  zil_lwb_commit+0x1c6/0x360 [zfs]
[Tue Jul 27 16:05:58 2021]  zil_process_commit_list+0xf1/0x210 [zfs]
[Tue Jul 27 16:05:58 2021]  zil_commit_writer.isra.0+0xa3/0xb0 [zfs]
[Tue Jul 27 16:05:58 2021]  zil_commit_impl+0x59/0xa0 [zfs]
[Tue Jul 27 16:05:58 2021]  zil_commit+0x40/0x60 [zfs]
[Tue Jul 27 16:05:58 2021]  zfs_fsync+0x7a/0xe0 [zfs]
[Tue Jul 27 16:05:58 2021]  zpl_fsync+0x5c/0x90 [zfs]
[Tue Jul 27 16:05:58 2021]  vfs_fsync_range+0x49/0x80
[Tue Jul 27 16:05:58 2021]  ? __fget_light+0x57/0x70
[Tue Jul 27 16:05:58 2021]  do_fsync+0x3d/0x70
[Tue Jul 27 16:05:58 2021]  __x64_sys_fsync+0x14/0x20
[Tue Jul 27 16:05:58 2021]  do_syscall_64+0x57/0x190
[Tue Jul 27 16:05:58 2021]  entry_SYSCALL_64_after_hwframe+0x44/0xa9
[Tue Jul 27 16:05:58 2021] RIP: 0033:0x7fc9636e7739
[Tue Jul 27 16:05:58 2021] Code: c0 0f 85 24 00 00 00 49 89 fb 48 89 f0 48 89 d7 48 89 ce 4c 89 c2 4d 89 ca 4c 8b 44 24 08 4c 8b 4c 24 10 4c 89 5c 24 08 0f 05 <c3> e9 d5 cb ff ff 41 57 41 56 53 48 81 ec 90 00 00 00 49 89 f6 b8
[Tue Jul 27 16:05:58 2021] RSP: 002b:00007fc9550bb508 EFLAGS: 00000246 ORIG_RAX: 000000000000004a
[Tue Jul 27 16:05:58 2021] RAX: ffffffffffffffda RBX: 000000000000004a RCX: 00007fc9636e7739
[Tue Jul 27 16:05:58 2021] RDX: 0000000000000000 RSI: 0000000000000000 RDI: 0000000000000009
[Tue Jul 27 16:05:58 2021] RBP: 00007fc9550bb580 R08: 0000000000000000 R09: 0000000000000000
[Tue Jul 27 16:05:58 2021] R10: 0000000000000000 R11: 0000000000000246 R12: 00007fc9550beb38
[Tue Jul 27 16:05:58 2021] R13: 0000000000000000 R14: 0000000000000000 R15: 00007fc9550beb74
[Tue Jul 27 16:05:58 2021] Modules linked in: ufs qnx4 hfsplus hfs minix ntfs msdos jfs cpuid vhost_vsock vmw_vsock_virtio_transport_common vhost vsock hid_plantronics nfs lockd grace fscache sunrpc unix_diag nf_conntrack_netlink xt_nat xt_tcpudp xt_conntrack xt_MASQUERADE xfrm_user xfrm_algo xt_addrtype overlay binfmt_misc veth ebtable_filter ebtables ip6table_raw ip6table_mangle ip6table_nat ip6table_filter ip6_tables iptable_raw iptable_mangle iptable_nat nf_nat nf_conntrack nf_defrag_ipv6 nf_defrag_ipv4 iptable_filter bpfilter nf_tables nfnetlink bridge stp llc nls_iso8859_1 xfs dm_multipath scsi_dh_rdac scsi_dh_emc scsi_dh_alua zfs(PO) zunicode(PO) zlua(PO) zavl(PO) icp(PO) zcommon(PO) znvpair(PO) spl(O) intel_rapl_msr intel_rapl_common sb_edac x86_pkg_temp_thermal intel_powerclamp coretemp kvm_intel ipmi_ssif kvm dcdbas ipmi_si rapl cp210x joydev intel_cstate mei_me ipmi_devintf input_leds usbserial mei ipmi_msghandler acpi_power_meter mac_hid sch_fq_codel ip_tables x_tables autofs4 btrfs
[Tue Jul 27 16:05:58 2021]  zstd_compress raid10 raid456 async_raid6_recov async_memcpy async_pq async_xor async_tx xor hid_generic usbhid hid raid6_pq libcrc32c raid1 raid0 multipath linear mgag200 drm_vram_helper i2c_algo_bit crct10dif_pclmul ttm crc32_pclmul ghash_clmulni_intel drm_kms_helper aesni_intel syscopyarea sysfillrect sysimgblt crypto_simd fb_sys_fops cryptd glue_helper drm ahci tg3 libahci lpc_ich megaraid_sas wmi
[Tue Jul 27 16:05:58 2021] CR2: 0000000000000008
[Tue Jul 27 16:05:58 2021] ---[ end trace fd486173467fef63 ]---
[Tue Jul 27 16:05:58 2021] RIP: 0010:avl_rotation.isra.0+0x211/0x240 [zavl]
[Tue Jul 27 16:05:58 2021] Code: 83 c8 01 49 89 43 10 48 85 db 75 27 48 8b 45 d0 4c 89 18 48 83 c4 10 b8 01 00 00 00 5b 41 5c 41 5d 41 5e 41 5f 5d c3 48 63 ff <4c> 89 14 fb e9 e5 fe ff ff 48 63 ff b8 01 00 00 00 4c 89 1c fb 48
[Tue Jul 27 16:05:58 2021] RSP: 0018:ffffb22ac842fb70 EFLAGS: 00010202
[Tue Jul 27 16:05:58 2021] RAX: 000000000000000a RBX: 0000000000000008 RCX: 0000000000000000
[Tue Jul 27 16:05:58 2021] RDX: 0000000000000001 RSI: ffff8c9865c79630 RDI: 0000000000000000
[Tue Jul 27 16:05:58 2021] RBP: ffffb22ac842fba8 R08: 0000000000000000 R09: 0000000000000008
[Tue Jul 27 16:05:58 2021] R10: ffff8c97dc004208 R11: 0000000000000000 R12: ffff8c97dc004210
[Tue Jul 27 16:05:58 2021] R13: 0000000000000000 R14: 00000000ffffffff R15: ffff8c9865c79630
[Tue Jul 27 16:05:58 2021] FS:  00007fc9550beb38(0000) GS:ffff8c9c0f180000(0000) knlGS:0000000000000000
[Tue Jul 27 16:05:58 2021] CS:  0010 DS: 0000 ES: 0000 CR0: 0000000080050033
[Tue Jul 27 16:05:58 2021] CR2: 0000000000000008 CR3: 000000053d9f4001 CR4: 00000000001606e0

I see ZFS noted a lot in the Call Trace - I am not very knowledgeable when it comes to that! :expressionless:

I have reasonable monitoring coverage (Zabbix) on the host so let me know if there other stats that might help point to the problem.

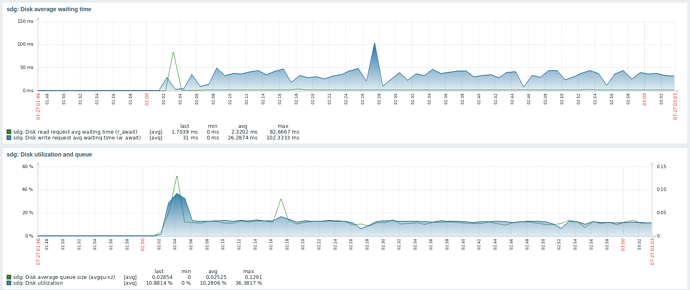
This is the graph from my media disk that is mounted into the container. It isn’t ZFS.

architecture: x86_64
config:
  image.architecture: amd64
  image.description: ubuntu 18.04 LTS amd64 (release) (20180911)
  image.label: release
  image.os: ubuntu
  image.release: bionic
  image.serial: "20180911"
  image.version: "18.04"
  raw.idmap: |-
    uid 122 111
    gid 126 115
  volatile.base_image: c395a7105278712478ec1dbfaab1865593fc11292f99afe01d5b94f1c34a9a3a
  volatile.eth0.host_name: veth374151be
  volatile.eth0.hwaddr: 00:16:3e:9c:a3:6d
  volatile.eth0.name: eth0
  volatile.idmap.base: "0"
  volatile.idmap.current: '[{"Isuid":true,"Isgid":false,"Hostid":1000000,"Nsid":0,"Maprange":111},{"Isuid":true,"Isgid":false,"Hostid":122,"Nsid":111,"Maprange":1},{"Isuid":true,"Isgid":false,"Hostid":1000112,"Nsid":112,"Maprange":999999888},{"Isuid":false,"Isgid":true,"Hostid":1000000,"Nsid":0,"Maprange":115},{"Isuid":false,"Isgid":true,"Hostid":126,"Nsid":115,"Maprange":1},{"Isuid":false,"Isgid":true,"Hostid":1000116,"Nsid":116,"Maprange":999999884}]'
  volatile.idmap.next: '[{"Isuid":true,"Isgid":false,"Hostid":1000000,"Nsid":0,"Maprange":111},{"Isuid":true,"Isgid":false,"Hostid":122,"Nsid":111,"Maprange":1},{"Isuid":true,"Isgid":false,"Hostid":1000112,"Nsid":112,"Maprange":999999888},{"Isuid":false,"Isgid":true,"Hostid":1000000,"Nsid":0,"Maprange":115},{"Isuid":false,"Isgid":true,"Hostid":126,"Nsid":115,"Maprange":1},{"Isuid":false,"Isgid":true,"Hostid":1000116,"Nsid":116,"Maprange":999999884}]'
  volatile.last_state.idmap: '[{"Isuid":true,"Isgid":false,"Hostid":1000000,"Nsid":0,"Maprange":111},{"Isuid":true,"Isgid":false,"Hostid":122,"Nsid":111,"Maprange":1},{"Isuid":true,"Isgid":false,"Hostid":1000112,"Nsid":112,"Maprange":999999888},{"Isuid":false,"Isgid":true,"Hostid":1000000,"Nsid":0,"Maprange":115},{"Isuid":false,"Isgid":true,"Hostid":126,"Nsid":115,"Maprange":1},{"Isuid":false,"Isgid":true,"Hostid":1000116,"Nsid":116,"Maprange":999999884}]'
  volatile.last_state.power: RUNNING
  volatile.uuid: a1b699a1-1aa0-4e45-8da1-2898b0d98298
devices:
  disk1:
    path: /myth/disk1
    source: /myth/disk1/
    type: disk
ephemeral: false
profiles:
- default
stateful: false
description: ""

The stack trace suggests an illegal memory access, so either a kernel bug or potentially a hardware issue.

The result was a failed ZFS intent log (ZIL) commit during an fsync operation.
It’s possible that ZFS can recover from it, but most likely what would happen is that particular ZFS thread is now defective and will remain so until the machine reboots.
This can in some cases causing an entire CPU core/thread to be effectively locked up.

I suspect any application on your system calling for a full sync will just hang indefinitely at this stage and as sync is system-wide and not only related to your instance’s own filesystem, this could explain an unrelated container getting stuck in a bad state.

Thanks Stéphane. What you say makes sense. I am at a bit of a loss as to how to resolve it.

Looking into my media disk (denoted in the pictures above), it is possibly in a bit of a bad state. I can mount/unmount without issue it but trying to run xfs_repair indicates that the device is busy when unmounted.

djwhyte@server1:/myth$ sudo umount /myth/disk1 
djwhyte@server1:/myth$ sudo xfs_repair /dev/sdg5
xfs_repair: cannot open /dev/sdg5: Device or resource busy
djwhyte@server1:/myth$ sudo mount /myth/disk1 
djwhyte@server1:/myth$ sudo xfs_repair /dev/sdg5
xfs_repair: /dev/sdg5 contains a mounted filesystem
xfs_repair: /dev/sdg5 contains a mounted and writable filesystem

fatal error -- couldn't initialize XFS library

Could this be a cause/effect of the explanation you gave?

Thanks.

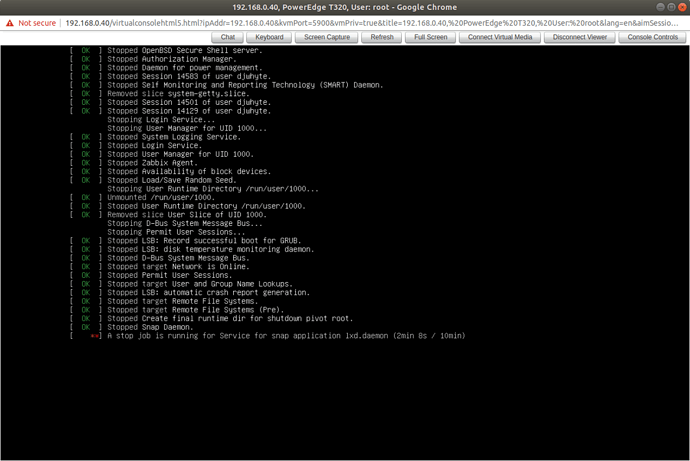
Rebooted the server. It took a full 10 minutes for the lxd service to shutdown. I assume this is because it would likely have been blocked by the sync you mentioned above.

After the reboot, we’re back to goodness, though I still don’t seem to be able to run xfs_repair on my media disk when unmounted :open_mouth:

So I think it could be one of two things:

  1. Something with my ZFS pool (single 1TB disk).
  2. Something wrong with my media disk.

I can work through number 2, but any hints at diagnosing number 1?

Cheers! :+1:

Hi,
For number one, zpool status and zpool status -x to diagnose pool and zfs.
Regards.

It has happened again today.

djwhyte@server1:~$ zpool status
  pool: default
 state: ONLINE
  scan: scrub repaired 0B in 0 days 00:16:44 with 0 errors on Sun Aug  8 00:40:46 2021
config:

	NAME        STATE     READ WRITE CKSUM
	default     ONLINE       0     0     0
	  sdc       ONLINE       0     0     0

errors: No known data errors
djwhyte@server1:~$ zpool status -x
all pools are healthy

It is the same Kernel Oops though; NULL pointer dereference. A quick Google search of a few different elements of the dmesg logs led me to BUG: kernel NULL pointer dereference, address: 0000000000000008 · Issue #10642 · openzfs/zfs · GitHub which is identical and another reporter has the same problem with Plex.

I will track it there…