Fantastic work all around on this project, so kudos for that!
I’ve just gotten a Windows VM set up using the guides from @stgraber and @simos. It’s working fine except that, even when the guest is idle, it’s using more than an entire CPU core on the host.
Host:
Recent-model Xeon 6C/12T at 4+ GHz
32 GB RAM
Ubuntu Server 20.04.2
LXD 4.16
All installed packages are fully up to date
Guest:
Limits: 4 cores, 4 GB, 50 GB storage
Win10 Pro
Removed as many preinstalled apps as possible
Disabled file content indexing on C:
Installed: Java 8, Jenkins agent (running), some build tools (not running), and Firefox (not running)
With the gust having just booted, with no RDP connection, top on the host shows 115% load for qemu-system-x86. When I connect via RDP and open Windows task manager, task mgr shows 5-7% CPU utilization while the host varies from 110% to 150%.
That thread seems to point towards hpet and effectively telling libvirt not to pass --no-hpet to qemu. In LXD’s case, we never passed --no-hpet so I’m not sure that it’s the same issue.
I was running around 200 Windows VMs for an event not too long ago and definitely didn’t see any such issues. I’ve also just taken a look at my long running win10 instance here and similarly am not seeing any issue here:
Do you think that could be relevant? I see that those are a VirtIO filesystem device and balloon device, respectively, but the VirtIO Guest Tools ISO doesn’t have any drivers that match those device IDs. Of note, there are 2 successfully-installed devices called “VirtIO FS Device” (device 105A) and “VirtIO Balloon Driver” (device 1045).
Possibly also worth mentioning is that the VM is on a btrfs pool on an LVM volume (which is on an mdraid mirror). Could it be that all the translations required to present block-based storage to the guest (especially with btrfs’s checksumming) might just incur too much overhead?
Nope, it’s normal for those two to not have drivers, one is virtiofs, the other virtio-vsock. The VGA card also uses a suboptimal driver.
All 3 have proper drivers in the work in the windows virtio driver project, but I have those same devices here so they wouldn’t be the issue.
The storage aspect could cause a lot of CPU time being burnt, in my case those VMs are either on ZFS or Ceph. But I wouldn’t expect such a large amount of CPU usage without Windows showing a good chunk of disk read/writes too.
Disk access in Win looks pretty normal, at least when Defender and Update aren’t doing anything. There does appear to be a steady hum of pagefile access even with 6GB RAM, so in a little while I’ll try disabling the pagefile.
Installation of the Win 20H2 update fails consistently (I think I installed from a 20H1 image), and I can’t seem to get the guest’s clock to stay in the correct time zone… so I may just grab a current Win image and try again, perhaps with a lighter-weight pool. I’ll report back.
I set up a second Win10 VM on the same host, and in the process made a couple of discoveries.
Secondary issue: Apropos of the problem installing Win updates on the original VM, I found that the original actually used the Win10 2004 release, not 21H1. This time around I did use 21H1, and it doesn’t have the issue. Not sure if there’s a slight incompatibility with 2004 or if I did something subtly different in the setup.
Primary issue: I figured out that the excessive host CPU load is being caused by the Jenkins agent on the Win guest, while the guest’s vCPU is essentially idle. Stopping the Jenkins agent drops the host load from ~125% to ~25%, i.e., totally frees up 1 CPU core.
Interestingly, disabling the virtual network adapter inside the guest (with the Jenkins agent running) shows a comparable drop. That doesn’t make a ton of sense, because even with networking enabled, the guest shows network traffic hovering between 0 and 24 kbps. Wireshark confirms just an occasional few kB of data exchanged with the Jenkins master node (plus normal broadcast traffic from the network and a periodic “phone home” to Microsoft).
Disk accesses in the guest remain constant in all cases.
All of this would seem to indicate that the Jenkins agent is somehow triggering the network virtualization code on the host to occupy a disproportionate amount of CPU time. I have no clue how the VirtIO drivers or QEMU work, but it feels like the kind of thing that results from polling for data. I’d tend to suspect the Jenkins agent, except in that case the guest CPU ought to be impacted, yet it’s not.
I’d greatly appreciate any assistance or suggestions in troubleshooting further. (This isn’t a debilitating issue, but it’s obviously undesirable to have a core spinning at full speed for no apparent reason.) Thanks!
This is certainly quite weird. Could you maybe try running an iperf3 server in that Windows VM and then do some tests to see what the host CPU impact is when running network tests?
It’s certainly looking like something is causing an unreasonable number of interrupts, causing a lot of needless context switches. If this was on Linux, I’d suggest running that agent under strace, but I have no idea what the Windows equivalent would be
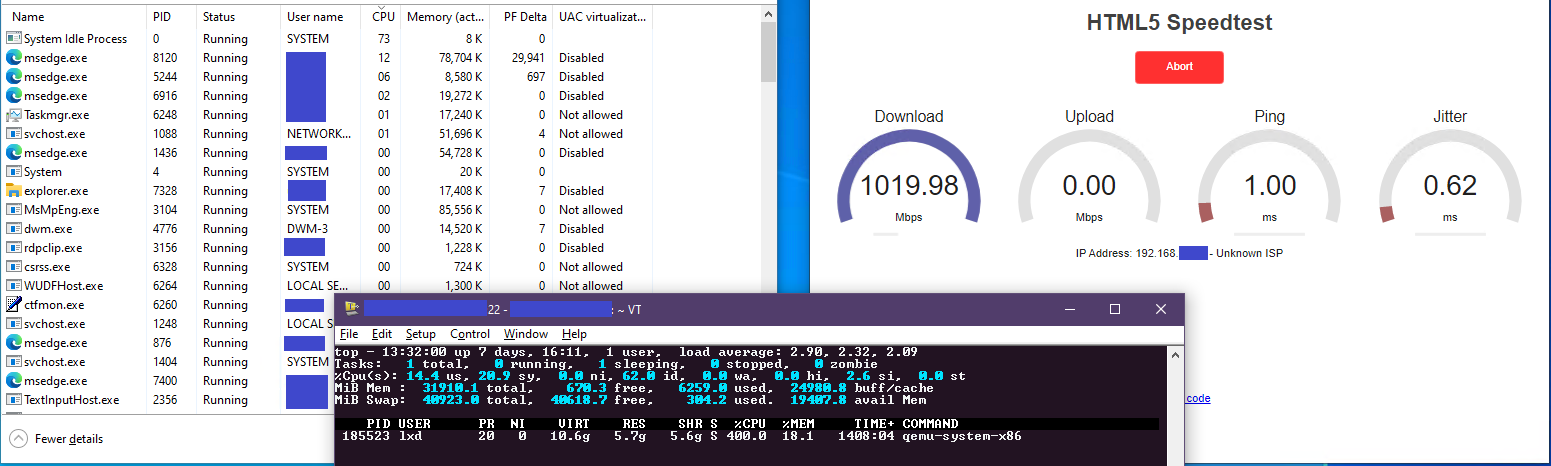
So happens I have a speedtest page hosted on one of our internal servers, so it was quicker for me to give that a whirl. Results follow. Only task manager and Edge were open on the guest, and the Jenkins agent was stopped.
Reported CPU load during download at 1 Gbps:
Guest task mgr: ~25% (1 of 4 cores in Windows’ scale)
Guest normalized: 100% (normalized to Linux’s single-core percentage)
Host: 400% (4 of 4 cores used)
During upload at 1 Gbps:
Guest task mgr: ~25%
Guest normalized: 100%
Host: 300%
During download at 100 Mbps (switch port forced to 100/full-duplex)
Guest task mgr: 36%
Guest normalized: 144%
Host: 380%
With speedtest page open but idle
Guest task mgr: 7%
Guest normalized: 28%
Host: 118%
With a basic, static page open in Edge
Guest task mgr: 7%
Guest normalized: 28%
Host: 51.5%
I have screenshots, but I’m only allowed 1 embed per message. I’ll try posting in followups.
I just now tried it, and it doesn’t appear to help. (In fact, the host was showing a slightly higher load than before – 425% vs 400%. Could be that the CPU clock was able to burst a little higher this time around, so let’s just stick with “it didn’t help”. )
So that you can double-check that I did it correctly, because I’m still an LXD noob…
user@server:~$ lxc info win-ci
Name: win-ci
Location: none
Remote: unix://
Architecture: x86_64
Created: 2021/07/27 03:11 UTC
Status: Running
Type: virtual-machine
Profiles: macvlan
Pid: 23002
Resources:
  Processes: -1
  Disk usage:
    root: 1.17GB
Snapshots:
  win10pro-clean-updated-20210726 (taken at 2021/07/27 04:18 UTC) (stateless)
  win10pro-java11-jenkins-agent (taken at 2021/07/27 22:25 UTC) (stateless)

user@server:~$ lxc profile show macvlan
config:
  environment.TZ: America/New_York
description: Test profile
devices:
  eth0:
    nictype: macvlan
    parent: enp3s0
    type: nic
  root:
    path: /
    pool: temp-pool
    type: disk
name: macvlan
used_by:
- /1.0/instances/win-ci

user@server:~$ ip addr show enp3s0
2: enp3s0: <BROADCAST,MULTICAST,UP,LOWER_UP> mtu 1500 qdisc mq state UP group default qlen 1000
    link/ether d4:5d:64:ef:76:b9 brd ff:ff:ff:ff:ff:ff
    inet6 2002:32c2:e805:2:d65d:64ff:feef:76b9/64 scope global dynamic mngtmpaddr
       valid_lft 2591745sec preferred_lft 604545sec
    inet6 fe80::d65d:64ff:feef:76b9/64 scope link
       valid_lft forever preferred_lft forever
Previously, the VM was using the default profile, which attached it to the host’s br0 (which, in turn, is sitting on top of a different physical iface on the machine).
I didn’t trust that the speedtest and Edge weren’t adding some hidden overhead, so I just did a quick test with iperf. I also didn’t trust that disk accesses (e.g., from paging) weren’t contributing to the host load, so I doubled the VM’s memory from 6 GB to 12 GB in this test.
The VM acted as the iperf server. Nothing else was running except task mgr.
Running a 30-second test 3 times yielded an average of 913 Mbps. Host load varied between about 305% and 345% when a test was in progress. VM’s task mgr reported between 20% and 25% utilization (normalize to 80% to 100%).
So, lower throughput but also lower load versus the speed test.