ZFS vs EXT4 Performance on High Load with LXD-Benchmark

Hi all!
Sorry for my English

Writing and Reading on ZFS is much slower than on EXT4, respectively, the creation of containers is also slow on ZFS (But the recommended setting is to use - ZFS)

I use the lxd-benchmark utility and fio for testing

300 containers per 13.215s on EXT4

benchmark:~# lxd-benchmark init --count 300 images:alpine/edge
Test environment:
Server backend: lxd
Server version: 5.0.2
Kernel: Linux
Kernel architecture: x86_64
Kernel version: 5.15.79-0-lts
Storage backend: dir
Storage version: 1
Container backend: lxc
Container version: 5.0.2

Test variables:
Container count: 300
Container mode: unprivileged
Startup mode: normal startup
Image: images:alpine/edge
Batches: 9
Batch size: 32
Remainder: 12

[Jun 12 15:42:04.143] Found image in local store: 8fc7a3303ef86c0877a76fc62a9d68a06f476a973d854727d39b4e0902dc5f77
[Jun 12 15:42:04.143] Batch processing start
[Jun 12 15:42:05.422] Processed 32 containers in 1.280s (25.009/s)
[Jun 12 15:42:06.730] Processed 64 containers in 2.587s (24.741/s)
[Jun 12 15:42:09.269] Processed 128 containers in 5.126s (24.970/s)
[Jun 12 15:42:15.229] Processed 256 containers in 11.086s (23.092/s)
[Jun 12 15:42:17.357] Batch processing completed in 13.215s

300 containers per 24.420s on ZFS

benchmark:~# lxd-benchmark init --count 300 images:alpine/edge
Test environment:
Server backend: lxd
Server version: 5.0.2
Kernel: Linux
Kernel architecture: x86_64
Kernel version: 5.15.79-0-lts
Storage backend: zfs
Storage version: 2.1.6-1
Container backend: lxc
Container version: 5.0.2

Test variables:
Container count: 300
Container mode: unprivileged
Startup mode: normal startup
Image: images:alpine/edge
Batches: 9
Batch size: 32
Remainder: 12

[Jun 12 16:09:33.158] Importing image into local store: 8fc7a3303ef86c0877a76fc62a9d68a06f476a973d854727d39b4e0902dc5f77
[Jun 12 16:09:37.468] Found image in local store: 8fc7a3303ef86c0877a76fc62a9d68a06f476a973d854727d39b4e0902dc5f77
[Jun 12 16:09:37.468] Batch processing start
[Jun 12 16:09:39.740] Processed 32 containers in 2.272s (14.082/s)
[Jun 12 16:09:41.710] Processed 64 containers in 4.242s (15.086/s)
[Jun 12 16:09:46.487] Processed 128 containers in 9.020s (14.191/s)
[Jun 12 16:09:57.408] Processed 256 containers in 19.940s (12.839/s)
[Jun 12 16:10:01.888] Batch processing completed in 24.420s

## Performing a Random Write Test on LXD with ZFS

fiozfs:~# sudo fio --name=randwrite --ioengine=libaio --iodepth=1 --rw=randwrite
–bs=4k --direct=0 --size=512M --numjobs=2 --runtime=240 --group_reporting
randwrite: (g=0): rw=randwrite, bs=(R) 4096B-4096B, (W) 4096B-4096B, (T) 4096B-4096B, ioengine=libaio, iodepth=1

fio-3.35
Starting 2 processes
randwrite: Laying out IO file (1 file / 512MiB)
Jobs: 2 (f=2): [w(2)][83.3%][w=180MiB/s][w=46.0k IOPS][eta 00m:01s]
randwrite: (groupid=0, jobs=2): err= 0: pid=482: Mon Jun 12 16:15:10 2023
write: IOPS=46.5k, BW=181MiB/s (190MB/s)(1024MiB/5642msec); 0 zone resets
slat (usec): min=5, max=192287, avg=40.12, stdev=933.48
clat (nsec): min=977, max=454355, avg=1494.36, stdev=1498.11
lat (usec): min=6, max=192292, avg=41.62, stdev=933.57
clat percentiles (nsec):
| 1.00th=[ 1020], 5.00th=[ 1032], 10.00th=[ 1048], 20.00th=[ 1064],
| 30.00th=[ 1080], 40.00th=[ 1096], 50.00th=[ 1128], 60.00th=[ 1368],
| 70.00th=[ 1672], 80.00th=[ 1752], 90.00th=[ 2224], 95.00th=[ 2928],
| 99.00th=[ 3728], 99.50th=[ 4256], 99.90th=[ 8096], 99.95th=[10688],
| 99.99th=[35584]
bw ( KiB/s): min=71152, max=317600, per=96.46%, avg=179280.73, stdev=37064.61, samples=22
iops : min=17788, max=79400, avg=44820.18, stdev=9266.15, samples=22
lat (nsec) : 1000=0.01%
lat (usec) : 2=87.57%, 4=11.87%, 10=0.49%, 20=0.05%, 50=0.01%
lat (usec) : 100=0.01%, 250=0.01%, 500=0.01%
cpu : usr=7.32%, sys=60.55%, ctx=13047, majf=0, minf=21
IO depths : 1=100.0%, 2=0.0%, 4=0.0%, 8=0.0%, 16=0.0%, 32=0.0%, >=64=0.0%
submit : 0=0.0%, 4=100.0%, 8=0.0%, 16=0.0%, 32=0.0%, 64=0.0%, >=64=0.0%
complete : 0=0.0%, 4=100.0%, 8=0.0%, 16=0.0%, 32=0.0%, 64=0.0%, >=64=0.0%
issued rwts: total=0,262144,0,0 short=0,0,0,0 dropped=0,0,0,0
latency : target=0, window=0, percentile=100.00%, depth=1

Run status group 0 (all jobs):
WRITE: bw=181MiB/s (190MB/s), 181MiB/s-181MiB/s (190MB/s-190MB/s), io=1024MiB (1074MB), run=5642-5642msec
fiozfs:~#

## Performing a Random Read Test on LXD with ZFS

fiozfs:~# sudo fio --name=randread --ioengine=libaio --iodepth=16 --rw=randread
–bs=4k --direct=0 --size=512M --numjobs=4 --runtime=240 --group_reporting
randread: (g=0): rw=randread, bs=(R) 4096B-4096B, (W) 4096B-4096B, (T) 4096B-4096B, ioengine=libaio, iodepth=16

fio-3.35
Starting 4 processes
randread: Laying out IO file (1 file / 512MiB)
Jobs: 3 (f=2): [r(2),f(1),_(1)][100.0%][r=306MiB/s][r=78.4k IOPS][eta 00m:00s]
randread: (groupid=0, jobs=4): err= 0: pid=518: Mon Jun 12 16:16:37 2023
read: IOPS=97.5k, BW=381MiB/s (400MB/s)(2048MiB/5375msec)
slat (usec): min=3, max=6845, avg=29.11, stdev=26.34
clat (usec): min=2, max=7732, avg=471.67, stdev=256.58
lat (usec): min=5, max=7817, avg=500.78, stdev=272.38
clat percentiles (usec):
| 1.00th=[ 83], 5.00th=[ 86], 10.00th=[ 87], 20.00th=[ 89],
| 30.00th=[ 363], 40.00th=[ 529], 50.00th=[ 578], 60.00th=[ 611],
| 70.00th=[ 644], 80.00th=[ 676], 90.00th=[ 717], 95.00th=[ 750],
| 99.00th=[ 840], 99.50th=[ 963], 99.90th=[ 1270], 99.95th=[ 1516],
| 99.99th=[ 2245]
bw ( KiB/s): min=930737, max=970672, per=100.00%, avg=948946.16, stdev=3650.52, samples=30
iops : min=232684, max=242668, avg=237236.28, stdev=912.61, samples=30
lat (usec) : 4=0.01%, 10=0.01%, 20=0.01%, 50=0.01%, 100=23.14%
lat (usec) : 250=4.59%, 500=9.19%, 750=58.18%, 1000=4.52%
lat (msec) : 2=0.35%, 4=0.01%, 10=0.01%
cpu : usr=8.39%, sys=90.87%, ctx=795, majf=0, minf=98
IO depths : 1=0.1%, 2=0.1%, 4=0.1%, 8=0.1%, 16=100.0%, 32=0.0%, >=64=0.0%
submit : 0=0.0%, 4=100.0%, 8=0.0%, 16=0.0%, 32=0.0%, 64=0.0%, >=64=0.0%
complete : 0=0.0%, 4=100.0%, 8=0.0%, 16=0.1%, 32=0.0%, 64=0.0%, >=64=0.0%
issued rwts: total=524288,0,0,0 short=0,0,0,0 dropped=0,0,0,0
latency : target=0, window=0, percentile=100.00%, depth=16

Run status group 0 (all jobs):
READ: bw=381MiB/s (400MB/s), 381MiB/s-381MiB/s (400MB/s-400MB/s), io=2048MiB (2147MB), run=5375-5375msec

## Performing a Random Write Test on LXD with EXT4

fioext4:~# sudo fio --name=randwrite --ioengine=libaio --iodepth=1 --rw=randwrit
e --bs=4k --direct=0 --size=512M --numjobs=2 --runtime=240 --group_reporting
randwrite: (g=0): rw=randwrite, bs=(R) 4096B-4096B, (W) 4096B-4096B, (T) 4096B-4096B, ioengine=libaio, iodepth=1

fio-3.35
Starting 2 processes
randwrite: Laying out IO file (1 file / 512MiB)

randwrite: (groupid=0, jobs=2): err= 0: pid=490: Mon Jun 12 16:18:53 2023
write: IOPS=523k, BW=2044MiB/s (2143MB/s)(1024MiB/501msec); 0 zone resets
slat (usec): min=2, max=318, avg= 2.41, stdev= 1.41
clat (nsec): min=745, max=317643, avg=834.70, stdev=1069.89
lat (usec): min=2, max=320, avg= 3.24, stdev= 1.79
clat percentiles (nsec):
| 1.00th=[ 772], 5.00th=[ 780], 10.00th=[ 788], 20.00th=[ 796],
| 30.00th=[ 796], 40.00th=[ 804], 50.00th=[ 804], 60.00th=[ 812],
| 70.00th=[ 812], 80.00th=[ 820], 90.00th=[ 852], 95.00th=[ 1112],
| 99.00th=[ 1192], 99.50th=[ 1208], 99.90th=[ 1224], 99.95th=[ 1416],
| 99.99th=[ 6688]
bw ( KiB/s): min=1047144, max=1047144, per=50.03%, avg=1047144.00, stdev= 0.00, samples=1
iops : min=261788, max=261788, avg=261788.00, stdev= 0.00, samples=1
lat (nsec) : 750=0.01%, 1000=93.45%
lat (usec) : 2=6.51%, 4=0.01%, 10=0.02%, 20=0.01%, 50=0.01%
lat (usec) : 500=0.01%
cpu : usr=42.56%, sys=57.24%, ctx=7, majf=0, minf=19
IO depths : 1=100.0%, 2=0.0%, 4=0.0%, 8=0.0%, 16=0.0%, 32=0.0%, >=64=0.0%
submit : 0=0.0%, 4=100.0%, 8=0.0%, 16=0.0%, 32=0.0%, 64=0.0%, >=64=0.0%
complete : 0=0.0%, 4=100.0%, 8=0.0%, 16=0.0%, 32=0.0%, 64=0.0%, >=64=0.0%
issued rwts: total=0,262144,0,0 short=0,0,0,0 dropped=0,0,0,0
latency : target=0, window=0, percentile=100.00%, depth=1

Run status group 0 (all jobs):
WRITE: bw=2044MiB/s (2143MB/s), 2044MiB/s-2044MiB/s (2143MB/s-2143MB/s), io=1024MiB (1074MB), run=501-501msec

## Performing a Random Read Test on LXD with EXT4

fioext4:~# sudo fio --name=randread --ioengine=libaio --iodepth=16 --rw=randread
–bs=4k --direct=0 --size=512M --numjobs=4 --runtime=240 --group_reporting
randread: (g=0): rw=randread, bs=(R) 4096B-4096B, (W) 4096B-4096B, (T) 4096B-4096B, ioengine=libaio, iodepth=16

fio-3.35
Starting 4 processes
randread: Laying out IO file (1 file / 512MiB)

randread: (groupid=0, jobs=4): err= 0: pid=526: Mon Jun 12 16:20:07 2023
read: IOPS=1150k, BW=4491MiB/s (4709MB/s)(2048MiB/456msec)
slat (nsec): min=1534, max=334129, avg=2128.92, stdev=1599.05
clat (nsec): min=1831, max=389773, avg=52773.81, stdev=8694.08
lat (usec): min=3, max=393, avg=54.90, stdev= 9.00
clat percentiles (usec):
| 1.00th=[ 48], 5.00th=[ 49], 10.00th=[ 50], 20.00th=[ 50],
| 30.00th=[ 50], 40.00th=[ 51], 50.00th=[ 51], 60.00th=[ 51],
| 70.00th=[ 52], 80.00th=[ 52], 90.00th=[ 60], 95.00th=[ 72],
| 99.00th=[ 74], 99.50th=[ 75], 99.90th=[ 86], 99.95th=[ 96],
| 99.99th=[ 388]
lat (usec) : 2=0.01%, 4=0.01%, 10=0.01%, 20=0.01%, 50=24.65%
lat (usec) : 100=75.30%, 250=0.01%, 500=0.03%
cpu : usr=42.53%, sys=56.86%, ctx=10, majf=0, minf=100
IO depths : 1=0.1%, 2=0.1%, 4=0.1%, 8=0.1%, 16=100.0%, 32=0.0%, >=64=0.0%
submit : 0=0.0%, 4=100.0%, 8=0.0%, 16=0.0%, 32=0.0%, 64=0.0%, >=64=0.0%
complete : 0=0.0%, 4=100.0%, 8=0.0%, 16=0.1%, 32=0.0%, 64=0.0%, >=64=0.0%
issued rwts: total=524288,0,0,0 short=0,0,0,0 dropped=0,0,0,0
latency : target=0, window=0, percentile=100.00%, depth=16

Run status group 0 (all jobs):
READ: bw=4491MiB/s (4709MB/s), 4491MiB/s-4491MiB/s (4709MB/s-4709MB/s), io=2048MiB (2147MB), run=456-456msec
Most standard LXD configurations are used
Using Alpine Linux on host and running temporarily in ram but when using disks the result is exactly the same

OS: Alpine Linux v3.17 x86_64
Host: ProLiant DL380p Gen8
Kernel: 5.15.79-0-lts
CPU: Intel Xeon E5-2667 v2 (32) @ 4.000GHz
Memory: 2129MiB / 257902MiB
Raid Mode: HBA

With ZFS

config: {}
networks:

  • config:
    ipv4.address: auto
    ipv6.address: auto
    description: “”
    name: lxdbr0
    type: “”
    project: default
    storage_pools:
  • config:
    size: 25GiB
    description: “”
    name: default
    driver: zfs
    profiles:
  • config: {}
    description: “”
    devices:
    eth0:
    name: eth0
    network: lxdbr0
    type: nic
    root:
    path: /
    pool: default
    type: disk
    name: default
    projects: []
    cluster: null

With EXT4

config: {}
networks:

  • config:
    ipv4.address: auto
    ipv6.address: auto
    description: “”
    name: lxdbr0
    type: “”
    project: default
    storage_pools:
  • config: {}
    description: “”
    name: default
    driver: dir
    profiles:
  • config: {}
    description: “”
    devices:
    eth0:
    name: eth0
    network: lxdbr0
    type: nic
    root:
    path: /
    pool: default
    type: disk
    name: default
    projects: []
    cluster: null

I will provide any information

The fact is that I want to use ZFS since PostgreSQL works faster in it, but the speed and reading forces me to use EXT4, which I really don’t want to

I configured ZFS to the maximum value, but in the end, reading and writing were not changed much

Why are standard LXD values so slow?
Maybe I’m doing something wrong?

Thanks for any help!
Regards.

Hello,

I’m not well versed in fio but I found this: https://github.com/axboe/fio/issues/512
Also, --direct=0 sounds like something that could be exercising the page cache only if you have enough RAM like you seem to have. I’d try enabling direct IO and see if ext4 performance is severely impacted.

I couldn’t find (maybe I missed it) if you were running the zpool as a loopback device or from dedicated SSDs/HDDs/NVMEs?

1 Like

Hello!

I temporarily use the OS and LXD on RAM so the speed is fast (I thought the problem is in my disks but no)

When using ZFS and EXT4 on disks, the result is the same (reads and writes are slow on ZFS)

I have 12 SAS HDDs of 6 TB

It’s not even about FIO, it’s about the slow creation of containers when using ZFS ( 300 containers per 13.215s VS 300 containers per 24.420s)

Because of what it can be?
Regards.

Incredible!

When using btrfs storage, creating 300 containers also takes 13 seconds

So why are the default ZFS values so slow?

300 containers per 13.992s on BTRFS
Test environment:
Server backend: lxd
Server version: 5.0.2
Kernel: Linux
Kernel architecture: x86_64
Kernel version: 5.15.79-0-lts
Storage backend: btrfs
Storage version: 6.0.2
Container backend: lxc
Container version: 5.0.2

Test variables:
Container count: 300
Container mode: unprivileged
Startup mode: normal startup
Image: images:alpine/edge
Batches: 9
Batch size: 32
Remainder: 12

[Jun 15 12:06:09.928] Found image in local store: eb985a39ce04f80c13a2e69ffadb0e74edd05299e1aaa155ece26c9386e71623
[Jun 15 12:06:09.928] Batch processing start
[Jun 15 12:06:11.204] Processed 32 containers in 1.275s (25.094/s)
[Jun 15 12:06:12.516] Processed 64 containers in 2.587s (24.735/s)
[Jun 15 12:06:15.191] Processed 128 containers in 5.262s (24.324/s)
[Jun 15 12:06:21.499] Processed 256 containers in 11.570s (22.126/s)
[Jun 15 12:06:23.920] Batch processing completed in 13.992s

Regards.

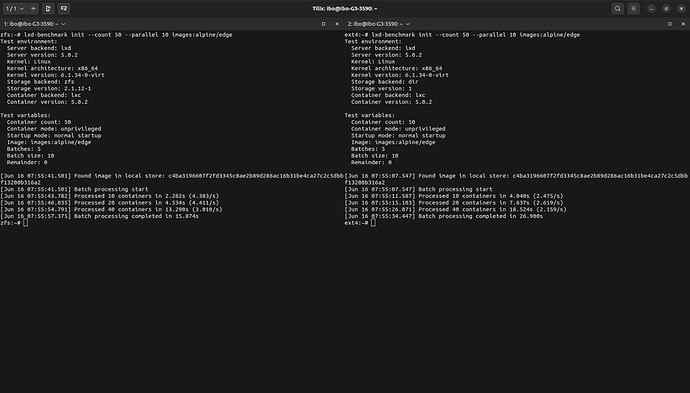
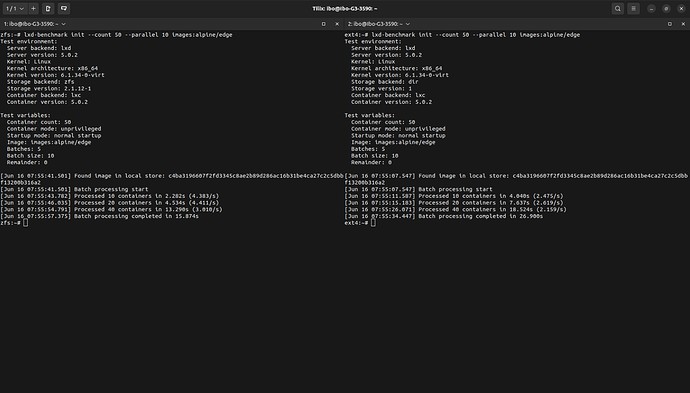
I decided to create 2 Alpine Linux VMs on my laptop and ran lxd-benchmark on them

ZFS speed was faster

So what’s the deal?
Why is the speed slower on the server when using ZFS?
Could this be because I’m using ZFS in the server’s RAM?

Any help is welcome

Regards.

I installed a temporarily clean Ubuntu on the server with the ZFS storage type and the speed is exactly the same slow

I don’t understand what’s wrong :frowning:

root@BenchUbuntu-ProLiant-DL380p-Gen8:~# lxd.benchmark init --count 300 images:alpine/edge
test environment:
Server backend: lxd
Server version: 5.14
Kernel: Linux
Kernel architecture: x86_64
Kernel version: 5.19.0-45-generic
Storage backend: zfs
Storage version: 2.1.5-1ubuntu6
Container backend: lxc | qemu
Container version: 5.0.2 | 8.0.0

test variables:
Container count: 300
Container mode: unprivileged
Startup mode: normal startup
Image: images:alpine/edge
Batches: 9
batch size: 32
Remainder: 12

[Jun 19 18:41:35.729] Found image in local store: 14fbda5ae7da2ee287159e7657ed224165daa3baecc0cbfbdbfd0f9fa6a8d4ec
[Jun 19 18:41:35.729] Batch processing start
[Jun 19 18:41:38.184] Processed 32 containers in 2.455s (13.035/s)
[Jun 19 18:41:40.634] Processed 64 containers in 4.905s (13.047/s)
[Jun 19 18:41:45.781] Processed 128 containers in 10.052s (12.733/s)
[Jun 19 18:41:58.107] Processed 256 containers in 22.379s (11.440/s)
[Jun 19 18:42:03.126] Batch processing completed in 27.397s

root@BenchUbuntu-ProLiant-DL380p-Gen8:~# lxc storage ls
±--------±-------±----------±------------±— -----±--------+
| name | DRIVER | SOURCE | DESCRIPTION | USED BY | STATE |
±--------±-------±----------±------------±— -----±--------+
| default | zfs | rpool/lxd | | 302 | CREATED |
±--------±-------±----------±------------±— -----±--------+

Installed clean Debian 12 and installed LXD with dir storage type

The speed is still faster than on ZFS

root@debian:~# lxd-benchmark init --count 300 images:alpine/edge
Test environment:
Server backend: lxd
Server version: 5.0.2
Kernel: Linux
Kernel architecture: x86_64
Kernel version: 6.1.0-9-amd64
Storage backend: dir
Storage version: 1
Container backend: lxc
Container version: 5.0.2

Test variables:
Container count: 300
Container mode: unprivileged
Startup mode: normal startup
Image: images:alpine/edge
Batches: 9
Batch size: 32
Remainder: 12

[Jun 20 17:57:39.965] Found image in local store: 379730c79f6192c829f360a2856e0e27b208faaab4f3306703b6b82e655a2466
[Jun 20 17:57:39.965] Batch processing start
[Jun 20 17:57:41.750] Processed 32 containers in 1.784s (17.933/s)
[Jun 20 17:57:43.397] Processed 64 containers in 3.432s (18.646/s)
[Jun 20 17:57:46.779] Processed 128 containers in 6.813s (18.787/s)
[Jun 20 17:57:55.226] Processed 256 containers in 15.261s (16.774/s)
[Jun 20 17:57:58.352] Batch processing completed in 18.387s
root@debian:~# lxc storage ls
±--------±-------±-----------------------------------±------------±--------±--------+
| NAME | DRIVER | SOURCE | DESCRIPTION | USED BY | STATE |
±--------±-------±-----------------------------------±------------±--------±--------+
| default | dir | /var/lib/lxd/storage-pools/default | | 301 | CREATED |
±--------±-------±-----------------------------------±------------±--------±--------+

Ibragim_Ganizade, can you detail what type of overall technical impact you are experiencing which is driving your focus on testing results ? To clarify, is there an issue beyond the results of lxd’s built-in artificial benchmarking utility ?

Hi! @CoolHandLuke

@stgraber’s video (https://youtu.be/z_OKwO5TskA) shows that ZFS is faster than DIR when using the lxd-benchmark utility

In my case, the turn and I do not understand what’s wrong
I used the standard LXD settings when creating ZFS and the speed is still slower than in EXT4

Is this the only issue you are experiencing ?

@CoolHandLuke Yes

The slow speed of ZFS compared to EXT4 is my only problem

Your results don’t seem unusual when using this benchmarking utility.

300 containers per 13.215s on EXT4 VS 300 containers per 24.420s on ZFS

Shouldn’t ZFS be faster?

Even when tested with the FIO utility, ZFS loses

I really want to use ZFS but I don’t understand how to solve this problem

Why should it be faster ?

Doesn’t Canonical recommend using ZFS with LXD?

  1. https://linuxcontainers.org/lxd/docs/latest/reference/storage_drivers/
  2. https://canonical.com/blog/lxd-2-0-installing-and-configuring-lxd-212

The video also shows that ZFS is faster https://youtu.be/z_OKwO5TskA

My above screenshot shows that ZFS is faster in a virtual machine (Tested on my ubuntu desktop with zfs installation)

Their benchmarking utility is not the best manner to observe the benefits of zfs. In general, ZFS performs very well for many container workflows.

Just because of the advantages of ZFS, I love it. But this moment with speed is very disappointing for me.

Maybe I’m doing something wrong?

Regards.

PS: I will use PostgreSQL on my containers