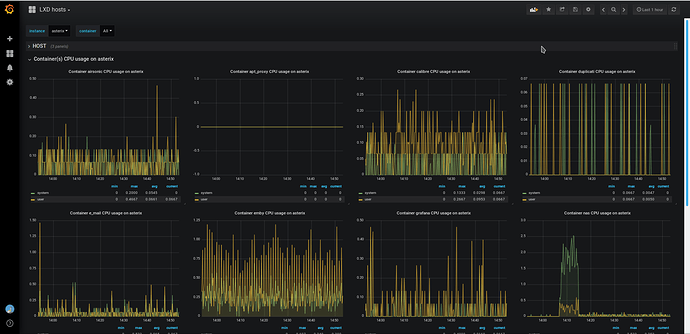
Monitoring/Graph from LXD host

Hi :slight_smile:

I there any specific “best practice” to monitor containers from host ?
If I want to watch basics metrics from CPU/RAM/SWAP/DISQUE/NETWORK store them somewhere and graph it ?

I was wondering if using LXD REST API each 5 minutes to each container would be acceptable ? All the information are in the lxc info command witch call the API anyways .
Maybe there is already ressources about it online but could not find anything

Thanks

1 Like

Every 5 minutes should be fine. It’s certainly not a cheap operation getting all that data from the kernel so you wouldn’t want to call it every few seconds, but every few minutes shouldn’t really be a problem.

To get an idea of what the API will give you:

curl --unix-socket /var/lib/lxd/unix.socket lxd/1.0/containers/c1/state | jq .metadata
{
  "status": "Running",
  "status_code": 103,
  "disk": {
    "root": {
      "usage": 9805824
    }
  },
  "memory": {
    "usage": 111071232,
    "usage_peak": 234029056,
    "swap_usage": 0,
    "swap_usage_peak": 0
  },
  "network": {
    "eth0": {
      "addresses": [
        {
          "family": "inet",
          "address": "10.204.119.69",
          "netmask": "24",
          "scope": "global"
        },
        {
          "family": "inet6",
          "address": "2001:470:b368:4242:216:3eff:fef4:db69",
          "netmask": "64",
          "scope": "global"
        },
        {
          "family": "inet6",
          "address": "fe80::216:3eff:fef4:db69",
          "netmask": "64",
          "scope": "link"
        }
      ],
      "counters": {
        "bytes_received": 57945,
        "bytes_sent": 4876,
        "packets_received": 417,
        "packets_sent": 38
      },
      "hwaddr": "00:16:3e:f4:db:69",
      "host_name": "vethSJ6ABH",
      "mtu": 1500,
      "state": "up",
      "type": "broadcast"
    },
    "lo": {
      "addresses": [
        {
          "family": "inet",
          "address": "127.0.0.1",
          "netmask": "8",
          "scope": "local"
        },
        {
          "family": "inet6",
          "address": "::1",
          "netmask": "128",
          "scope": "local"
        }
      ],
      "counters": {
        "bytes_received": 0,
        "bytes_sent": 0,
        "packets_received": 0,
        "packets_sent": 0
      },
      "hwaddr": "",
      "host_name": "",
      "mtu": 65536,
      "state": "up",
      "type": "loopback"
    }
  },
  "pid": 22156,
  "processes": 29,
  "cpu": {
    "usage": 6312866518
  }
}
2 Likes

Good , it should be a contribution :slight_smile:
Hope to do something about it

is there a reason to this on the host using the api instead of the container itself using the “usual tools”, aka collecd/l, munin, a nagios agent, etc? I could see how with a lot of containers that could get more expensive CPU wise so maybe that’s a good enough reason, but on the other hand for higher frequency metric collections that may still acceptable/better. thoughts?

Nope, using the usual tools works just fine and it’s in fact what I’m doing on my own containers.

The main benefit from doing it at the host level using the API is that you don’t need to have software running in those containers, which may be very useful if you’re not yourself the owner of those containers (running third party images or having a third party run them).

2 Likes

it’s exactly the use case where I’m not the owner of the container but I want to be able to do some basic monitor.

In our containers, we use the “usual tools” like for any host :slight_smile:

I like telegraf + grafana + influxdb,
So in our environment we running python script (via telegraf) on the lxd host which grabs as much as possible metrics from /sys/fs/cgroup/*, another ones via pylxd and put the metric to influxdb.
Visualised in grafana dashboard.

Still WIP, maybe i’ll put it somewhere to my git - it looks “ugly” i’m not a programmer.

So global stats/metrics gathered from one place, containers itself runs telegraf only for specific metrics - for example mysql/redis/memcached metrics.

1 Like

That’s a good combo.
I never used telegraf.
Let me know if you put it on GIT i’ll have a look and maybe see if I can contribute as well.

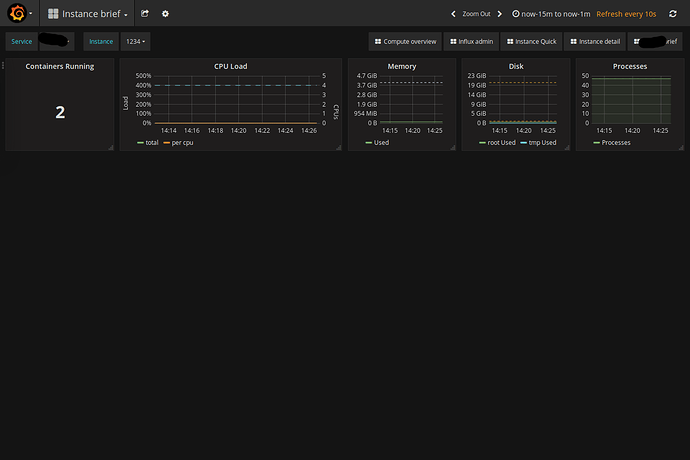
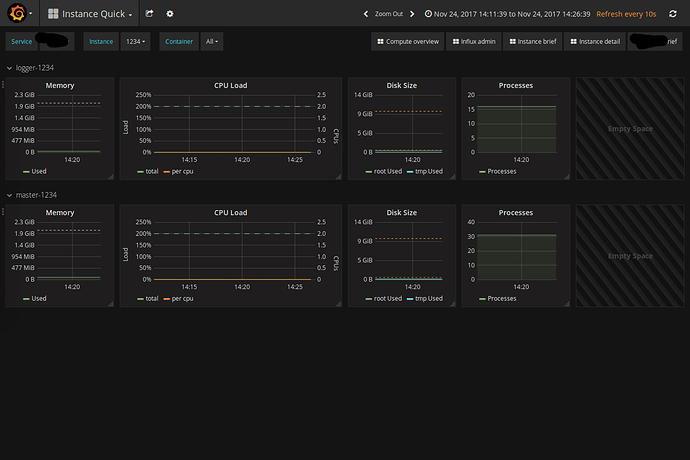
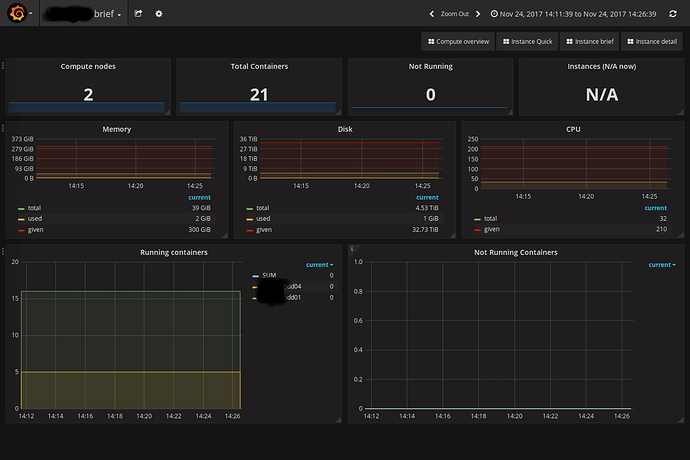
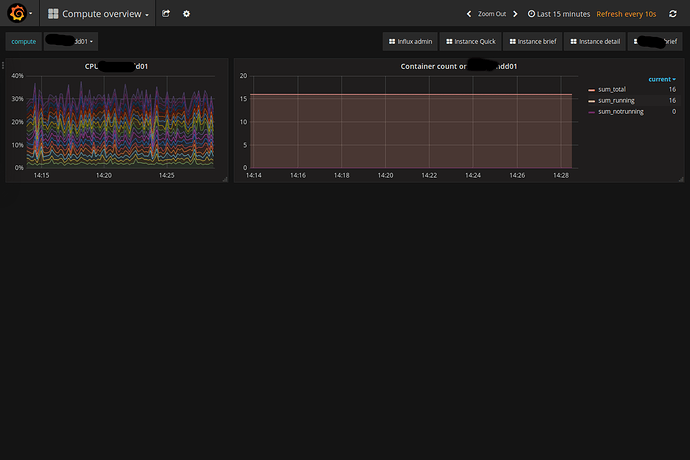
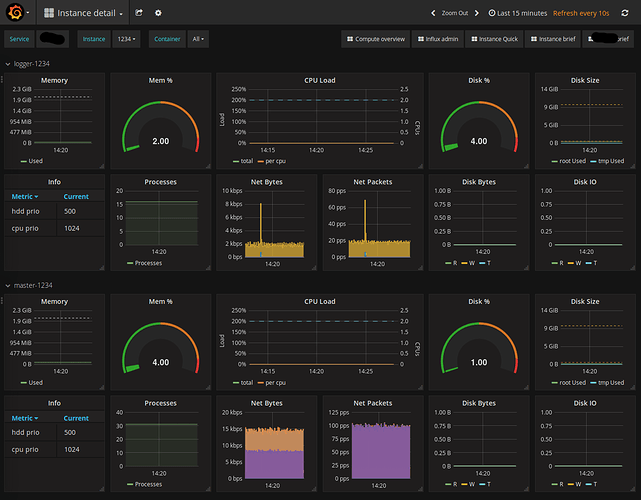
Can you share the dashboard you have on grafana to get an idea on how you can present the datas ?

Thanks :slight_smile:

Sure
in our environment - “instance” is group of containers (instance number)
each instance has its own vxlan separated from another instances.
and “master” container is router/balancer to the internet for the whole instance - just for clarification.
and as i noted - still wip, so numbers may be little odd.

edit: during the weekend i’ll create new github repo for the metric-gathering script, but really - it is ugly af :slight_smile:

2 Likes

Thank you :slight_smile:

The dashboard looks very nice and the content is relevant.
I will definitively look into it

Cheers

Yes, thanks for this! We built a simplistic tool using a combination of Redis and DataTables (https://datatables.net/). We have a cron job kick off every 5mins on each container server to get a list of containers then publish the data to Redis. On our management server, we query the Redis database and create a dynamic html page with a listing of all containers. This method allows us to quickly see how many containers we have running with their corresponding details (OS version, when started, RAM, CPU, etc).

Your tool is a much improved version of what we have been doing.

-Ron

definitely interested myself in the telgraf+grafana+influx, that’s what I’m
setting up for a bunch of other hosts, but I got curious about netdata and
may end up replacing the telegraf and python script part with it since it
has the benefit of being lxc aware already and give you realtime stats. but
definitely look forward to see the python script and hear more about the
setup. thanks

There is sysdig and falco, which install a kernel module that does precise monitoring.
I wrote an intro about them at https://blog.simos.info/how-to-use-sysdig-and-falco-with-lxd-containers/

It may not be suitable since it is quite intrusive to the host to load a kernel module.
Also, for the nice graphs, you would need to pay for a license. Just adding in this thread for completeness.

1 Like

Here it is

but use it at your own risk :slight_smile:
Don’t have time to polish it or make it better right now
and i’m definitely look into sysdig, it looks very promising.

1 Like

Just playing around a bit with netdata (https://github.com/firehol/netdata) to collect all the statistics/metrics, Prometheus (https://prometheus.io/) for gathering them for a longer time and grafana to graph it all. I must say it’s pretty easy to set up. Still fighting to let my graphs stay the same size in grafana, but I am getting there sooner or later :wink:

3 Likes

We also use netdata, great monitoring that displays containers metrics.
It gets container name from CGroups I think.

I switched to graphite now instead of Prometheus, since I use graphite to save my zpool status,since netdata doesn’t deliver those.

I also don’t get disk io from a container…stays zero all the time :frowning:

i am trying your appraoch. Should i install netdata in each container or should i install netdata+prometheus+grafana on the host ?
Is there any dashboard for grafana to get matrices of lxd containers from prometheus ?

I have netdata installed on the host only. No need to run it in a container. Graphite (I am not using prometheus anymore) and Grafana are running in a container (which runs docker containers for both grafana and graphite since it’s easy to set-up :slight_smile: ), so it keeps the host clean and I can move it to another LXD host whenever I want :slight_smile:

I don’t know if there’re any global grafana dashboards available with prometheus as backend.

I can share my grafana/graphite dashboard which you can fine tune for yourself, but it’s not possible to use “-” in the containername (got me headaches to get them correctly filtered in grafana, so I took the easy way out :wink: )

Are you using Graphite and Grafana in a container to monitor your host? I want to keep my hosts as clean as possible without installations like netdata etc. Did you get this working? or is netdata required?